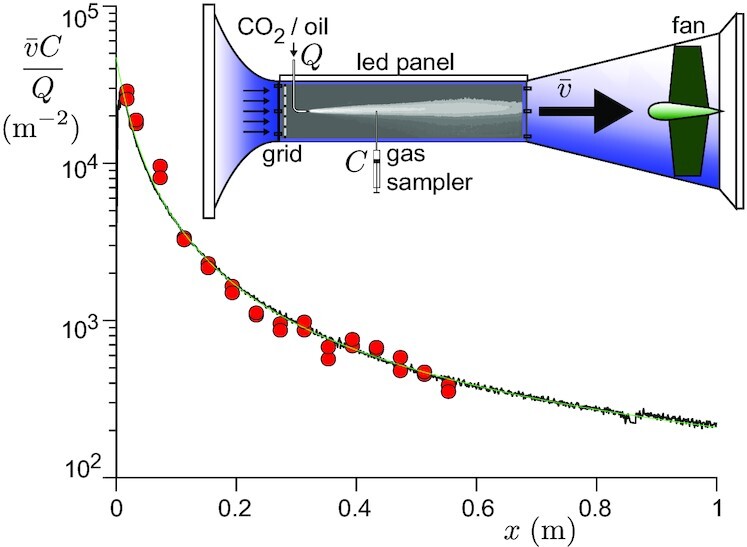
Fig. 2.

Rescaled concentration profile of 10-μm-size oil droplets (black solid line) and CO2 (red circles) in a wind tunnel experiment. The CO2 concentration along the axis is measured after sampling the gaz with a syringe. The oil droplet concentration is measured using the optical absorption of light. CO2 and oil aerosol are introduced successively at a rate Q, 20 cm downstream of the turbulence generating grid. The working velocity is  . The green line is the best fit by Eqs. (1) and (2).
