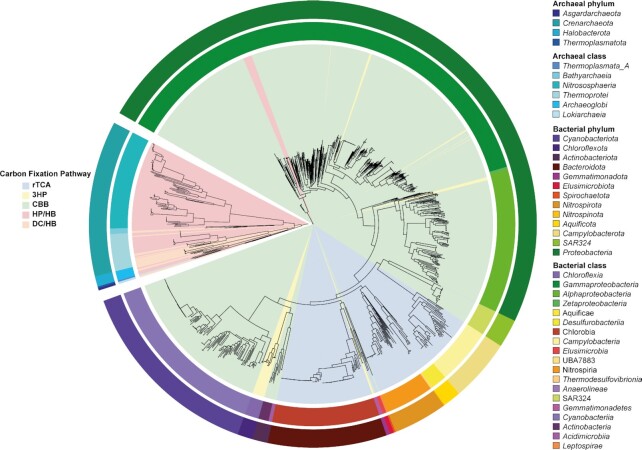
Fig. 1.
Phylogenetic tree representing the distribution of the different CFPs across the bacterial and archaeal domains of life in 1,007 MAGs. The outer ring is colored by the phylum, while the inner ring shows classes. Shading in the cycle shows the five different CFPs analyzed by the pipeline (see text for details).

