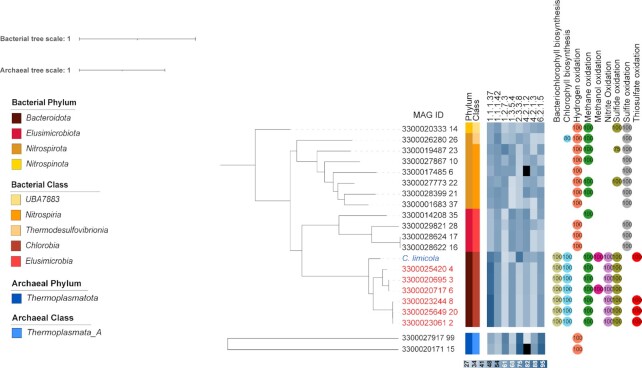
Fig. 2.
Phylogenetic tree showing the distribution of the rTCA cycle in novel bacterial and archaeal taxa and in known organisms from the family Chlorobiaceae (blue: reference genome in blue; red: MAGs assigned to the same family as the reference genome). Identity of the enzymes involved in the pathway against the UniRef database are shown in blue heat scale. 1.1.1.37: pyruvate-water dikinase; 1.1.1.42: isocitrate dehydrogenase; 1.2.7.3: 2-oxoglutarate-synthase; 1.3.5.4: phosphoenolpyruvate carboxylase; 2.3.3.8: ATP-citrate lyase; 4.2.1.2: fumarase; 4.2.1.3: aconitate hydratase; 6.2.1.5: succinyl-CoA synthetase. Numbers in circles refer to completeness of diagnostic pathways for energy generation. Black squares in the heatmap refers to missing enzymes.

