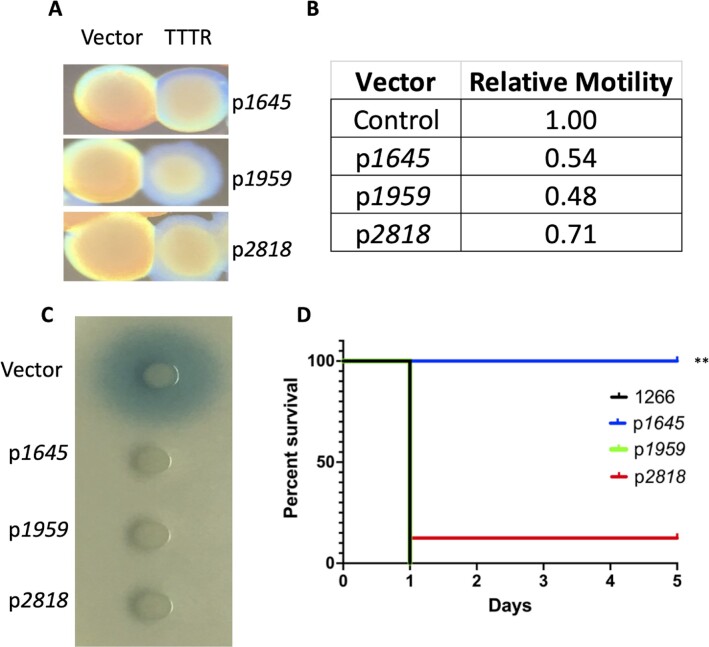
Fig. 1.
Effects of TTTR overexpression in VIR-O cells. Panel A: A representative VIR-O colony with pWH1266 vector alone is shown next to a representative colony overexpressing the indicated TTTR. All colonies for a given pair are from the same plate. Panel B: Relative motility of strains determined on 0.35% Eiken agar plates after 14 hours of incubation. Numbers represent the ratio of motility compared to VIR-O cells with pWH1266 vector alone and are the average of three biological replicates. All values had a P-value < 0.05 when compared to the pWH1266 vector control by an unpaired t-test. Panel C: Secretion of the quorum sensing 3-OH-C12-HSL determined using an Agrobacterium tumefaciens traG-lacZ soft agar overlay. For each strain, 1 μl of a midlog phase culture at equal density was spotted on the agar surface and incubated for 20 to 24 hours at 28°C. A representative plate is shown. Panel D: Virulence of TTTR overexpressing strains. Indicated strains were used to infect mice intranasally and survival was monitored daily. A ** indicates a P-value of <0.001 determined by a Mantel–Cox test.

