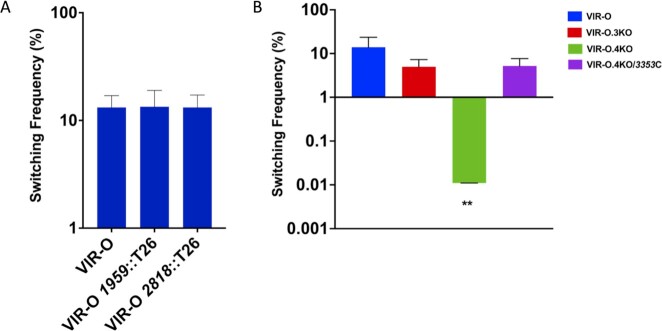
Fig. 3.
Switching frequency of VIR-O mutants. Panel A: Individual TTTR mutants with the relevant mutation shown below each strain. Panel B: Switching frequency for the triple (VIR-O.3KO) and quadruple TTTR (VIR-O.4KO) mutants along with VIR-O.4KO complemented with ABUW_3353 (3353C). Each value represents the switching frequency from VIR-O to the translucent variant and was determined from the average of three to six colonies after 24 hours of growth on O.5X LB agar plates with SDs shown. **P-value = 0.0019 (Welch’s ANOVA)

