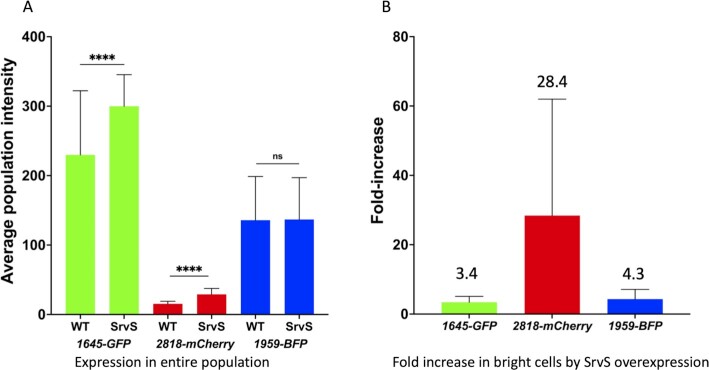
Fig. 5.
Effect of SrvS overexpression on expression of TTTRs in single cells. In Panel A, VIR-O.TF or SrvS overexpressing VIR-O.TF-HR cells each containing three single-copy transcriptional fusions to fluorescent reporters ABUW_1645-GFP,ABUW_2818-mCherry, and ABUW_1959-mTAG BFP2 were imaged for fluorescence in individual cells taken from colonies at 9 hrs of growth on LB plates. The reported value reflects the average of over 5,000 cells for each condition and standard deviations are shown. A *** represents a P-value < 0.001. Panel B: Cells were imaged for expression of each reporter at 9 hours of growth and the average cell intensity is shown for the brightest 2% of cells in the SrvS overexpressing strain and then compared to the number VIR-O.TF cells in the ON state at the same relative fluorescence intensities. For panels A and B, the values are the average of three biological replicates with SDs.

