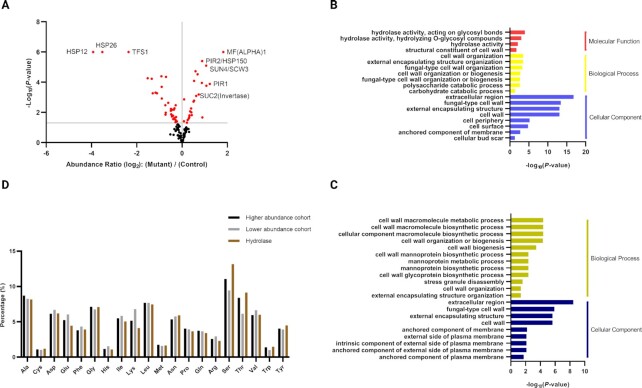
Fig. 5.
Global analysis of yeast secretome in the PIL1 deletion strain by mass spectrometry. (A) Abundance ratio of quantified secreted proteins between the PIL1 mutant and the wild-type. The ratio is presented in Log2 fold change. Red spots represent abundance ratios with P-value lower than 0.05. Some proteins with significant changes in secretion are annotated. (B) Gene ontology analysis of secreted proteins identified with higher abundance. (C) Gene ontology analysis of secreted proteins identified with lower abundance. (D) Percentages of amino acids in the protein sequence of higher and lower abundance cohorts and identified hydrolases. All data were derived from three SILAC experiments.

