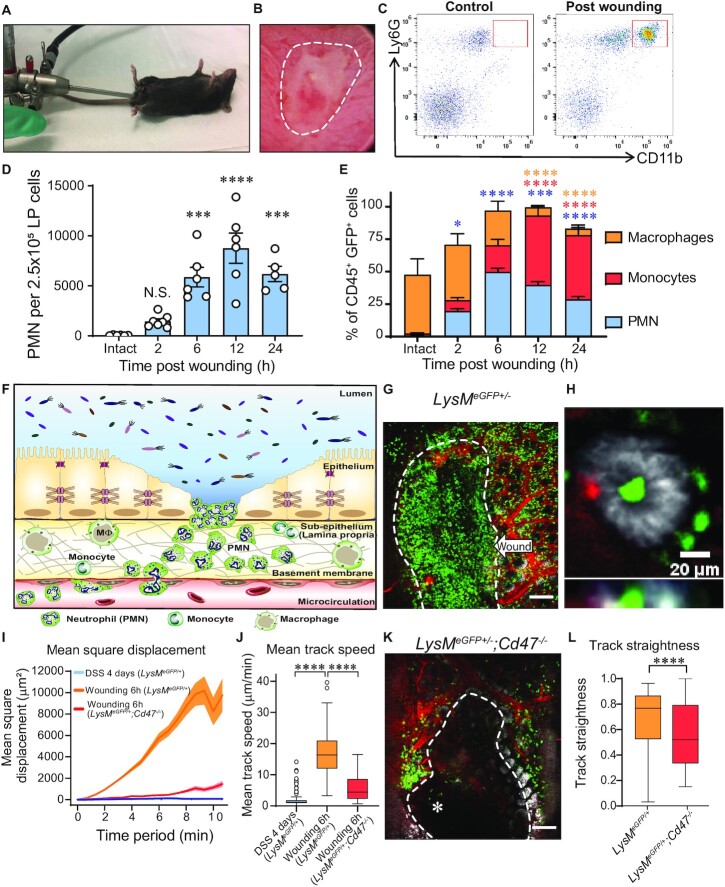
Fig. 3.
Acute mucosal wounds induce PMN swarming. (A and B) Rodent colonoscope and representative image of colonic biopsy-based wound. (C) Representative flow cytometry plot showing transmigrated PMNs (CD45+Ly6G+CD11bhigh) in wounded mucosa compared to intact tissue. (D and E) Quantification of wound-associated PMNs after biopsy-induced colonic injury (0 to 24 h). (D) Graph represents number of PMNs per 2.5 × 10⁵ cells of lamina propria cells. Data are means ± SEM of two independent experiments (n = 5 to 7 mice per group; ***P < 0.001; ****P < 0.0001 compared to Intact tissue by one-way ANOVA). (E) Represents percentage of wound associated GFP+ cells. Data are means ± SEM of two independent experiments (n = 5 to 7 mice per group; *P < 0.05; ***P < 0.001; ****P < 0.0001 compared to Intact tissue by two-way ANOVA. Asterisk colors represent compared groups matching figure keys). (F) Schematic overview of biopsy-wounding model: GFPhigh PMNs swarming towards focalized, acute mucosal ulcer, characteristic of ulcerative colitis. (G) Representative image of GFPhigh PMNs swarming towards a colonic biopsy wound (white-dashed line) (green = GFP, red = vasculature, white = EpCAM). White-dashed line limits the wounded area. Scale bar: 200 μm. (H) Representative image of PMNs interacting with intestinal epithelial cells (green = GFP, red = vasculature, white = EpCAM). Scale bar: 20 μm. (I and J) Comparison of PMN dynamics on DSS-treated and LysMeGFP/+vs. Cd47−/−; LysMeGFP/+ wounded mice (tracks of at least 20 GFPhigh PMN per mouse; n = 3 to 6 mice per group). (I) Mean square displacement and (J) Mean track speed. Data are represented as median (interquartile range). ****P < 0.0001 as determined by Wilcoxson–Mann–Whitney nonparametric test. (K) Representative images of PMN swarming towards a colonic mucosal wound on Cd47−/−; LysMeGFP/+mice (green: GFP, red: vasculature, white: EpCAM). White-dashed line limits wounded area. Asterisk points to migrating PMNs into wound. Scale bar: 100 μm. (L) Comparison of PMN track straightness on LysMeGFP/+vs. Cd47−/−; LysMeGFP/+wounded mice. Tracks of at least 20 GFPhigh PMNs per mouse; n = 3 to 6 mice per group. Data are represented as median (interquartile range). ****P < 0.0001 as determined by Wilcoxson–Mann–Whitney nonparametric test.

