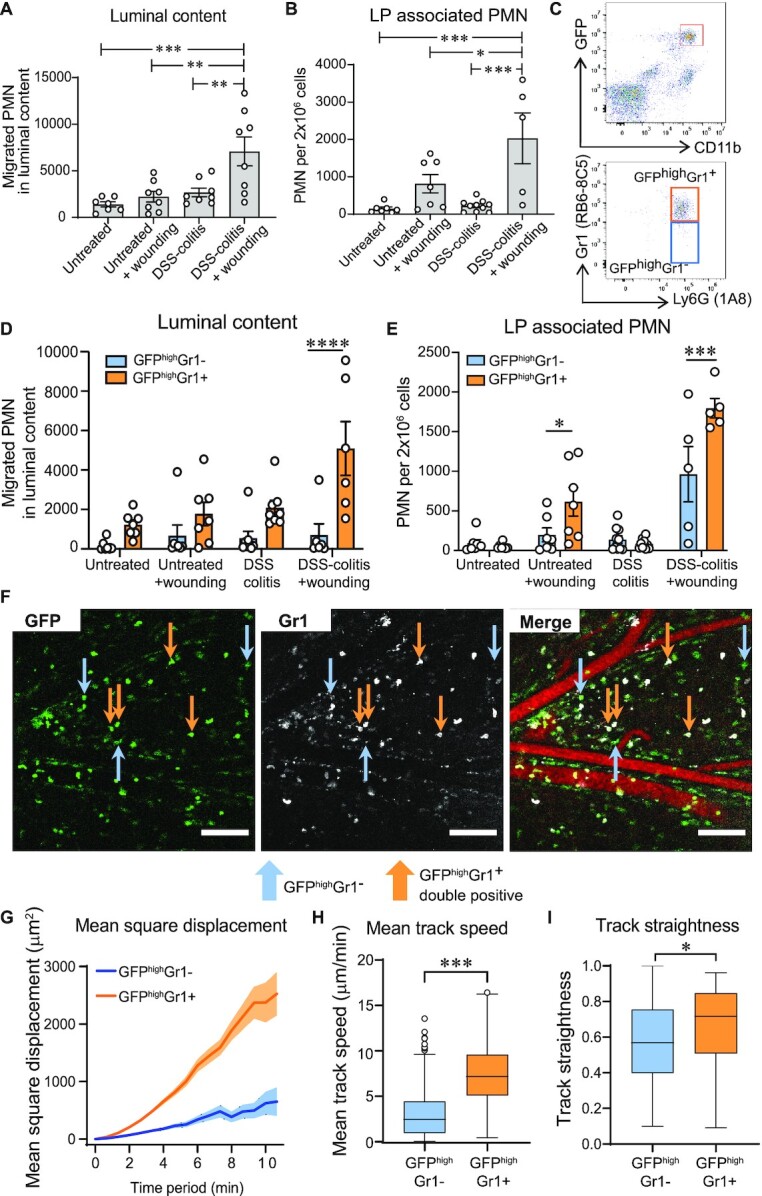
Fig. 4.

PMNs demonstrate different dynamics in response to mechanism and timing of mucosal injury. (A and B) Quantification of PMNs in the DCL model of mice submitted to different injury models as presented in Supplementary Table S1. (A) PMN TEpM into luminal content in response to LTB4. (B) Absolute numbers of PMNs infiltrating the lamina propria. Data is mean ± SEM of two independent experiments (n = 5 to 9 mice per group; *P < 0.05; **P < 0.01 ***P < 0.001 by one-way ANOVA). (C to E) Quantification of differentially labeled PMNs (GFPhighGr1+ and GFPhighGr1−) in the DCL model. (C) Gating strategy of the luminal content showing PMNs differentially stained with Gr1 after gating on CD45+GFP+CD11bhighLy6G+. (D) Gr1+ and Gr1− PMNs transmigrated into the lumen of DCL in response to LTB4. (E) Absolute numbers of Gr1+ and Gr1− PMNs infiltrating the lamina propria. Data are mean ± SEM of two independent experiments (n = 5 to 7 mice per group; *P < 0.05; ***P < 0.001; ****P < 0.0001 by two-way ANOVA). (F) Representative confocal-IVM images of DCL of mice subjected to DSS + wounding showing GFP (left) and Gr1staining (center). Merged channels (right) show two differentially stained PMNs: GFPhighGr1− PMNs (blue arrows pointing at only green cells, as PMNs recruited into lamina propria in response to DSS), and double-labelling of GFPhighGr1+ PMNs (orange arrows pointing at green and white cells, as PMNs recruited from circulation in response to biopsy-wounding), as seen in the Supplemental Movie S9 (Green = GFP, white = Gr1, red = vasculature,). Scale bars: 100 μm. (G to I) Comparison of (G) Mean square displacement, (H) Mean track speed, and (I) Track straightness between GFPhighGr1+ and GFPhighGr1− PMNs. Tracks of at least 20 PMNs per group. Data are represented as median (interquartile range) (n = 9 mice per group; *P < 0.05; ****P < 0.0001 as determined by Wilcoxson–Mann–Whitney nonparametric test).
