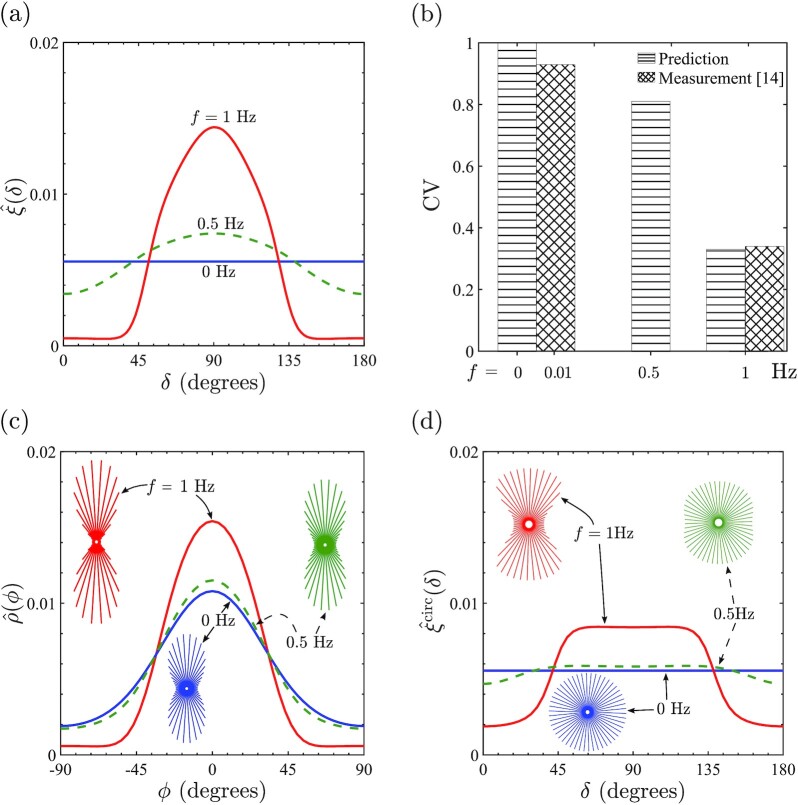
Fig. 2.
(a) Predictions of the angular distributions of SF concentrations as parameterized by  , where δ is the orientation of the SFs with respect to
  -direction of cyclic stretching. Results are shown for cyclic loading (r = 0) with εamp = 0.1 and f = 0.5, 1 Hz, together with the reference case of no imposed cyclic loading (i.e. f = 0). (b) Comparison of the predicted and measured (14) CVs, defined by (12), for selected frequencies f and εamp = 0.1. (c) The angular distributions of the SF concentrations as parameterized by
  within cell with ϕ denoting the orientation of the SFs with respect to the major axis of the ellipse. Predictions are shown for the three straining cases in (a) with the corresponding circular histograms shown as insets. (d) The angular distributions and circular histograms for SFs parameterized by
  for a circular cell of radius R0 and subjected to the three straining cases in (a).

