Fig. 8.
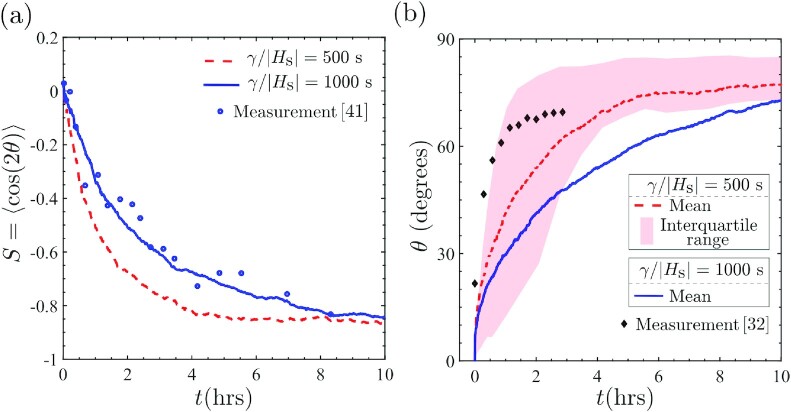
Comparison between measurements and predictions of the temporal evolution of cell orientation with two choices of the damping co-efficient γ/|Hs| = 500 s and 1,000 s. (a) Order parameter S = 〈cos(2θ)〉 is compared with measurements of Jungbauer et al. (41). Cells are randomly oriented at t = 0 and align perpendicular to the strain direction at large times. (b) Evolution of the orientation of a single cell oriented at θ = 0○ and ≈20○ at t = 0 in the predictions and measurements (32), respectively. The interquartile of the predictions over the 1,000 Langevin trajectories are indicated in (b) for γ/|Hs| = 500 s.

