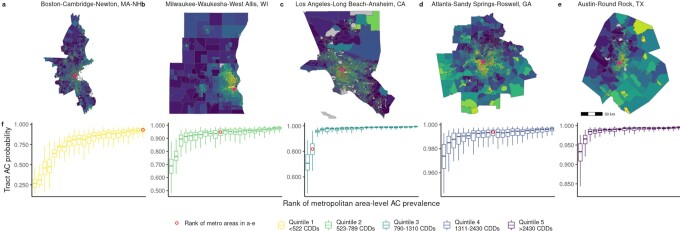
Fig. 1.
Intra-metropolitan area variation in percentile ranking of predicted probability of residential AC in five metro areas (a to e), each representing a quintile of regional climate (annual metropolitan area cooling degree days). Pink dots denote the metro area downtown or financial center. 5th percentile, median, and 95th percentile of metro area probabilities (f), grouped by CDD quintile.

