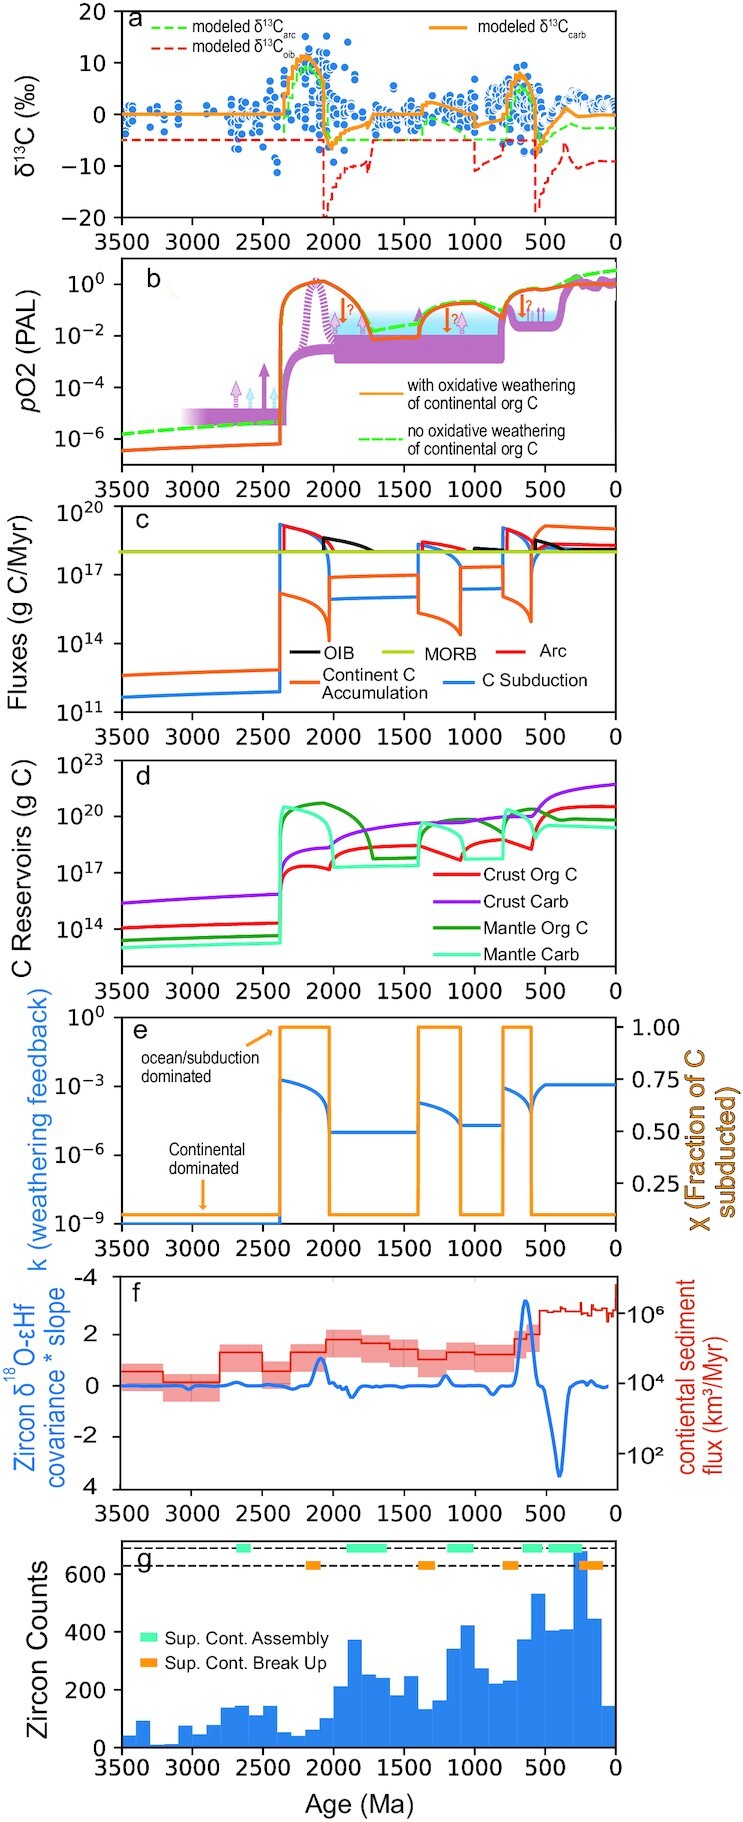
Fig. 2.

Model results for atmospheric oxygen and δ13C of marine carbonates compared with natural data. (a) δ13C of marine carbonates and volcanic centers versus time. Blue data points are natural data from Krissansen-Totton et al. (8). Orange curve is model result for carbonates, red and green curves are modeled δ13C for arcs and ocean islands, respectively. (b) Atmospheric oxygen level (PAL) through time. Pink curve and blue-shaded region is proposed evolution of atmospheric oxygen based on various proxies (7). See (7) for detailed explanation of proxy curve. Orange curve is model result with oxidative weathering of crustal organic C and green-dashed curve is model result without oxidative weathering of crustal organic C. Orange downward pointing arrows with question marks were included to illustrate possible lower levels of O2 if a complete consideration of oxygen sinks was included. (c) Modeled C fluxes from different volcanic settings and the C drawdown flux from atmosphere driven by silicate weathering. (d) Modeled C reservoirs through time. (e) Prescribed values of k (strength of silicate weathering feedback through time) and χ (fraction of buried C that is subducted) through time. k and χ are the drivers of all perturbations in the model. (f) Blue curve is covariance times the slope of δ18O-εHf in zircons from Keller et al. (53). Peaks in this curve are suggested to signal periods of enhanced subduction of continental weathering products. Orange curve is estimated continental sediment flux through time from Husson and Peters (56). (g) Frequency of zircons through time from Tang et al. (60) and times of supercontinent break-up and assembly from Condie and Aster (49).
