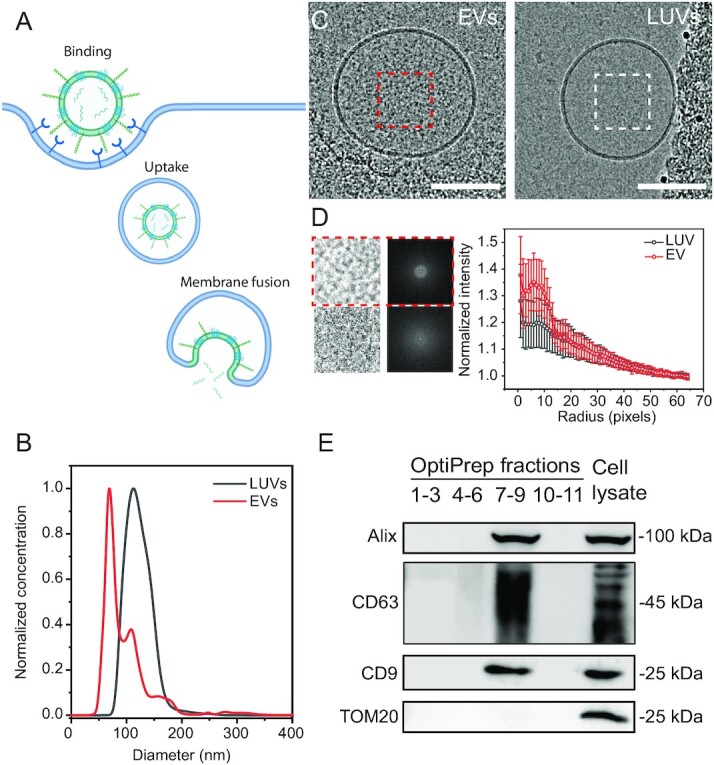
Fig. 1.

EV–LUV in vitro system to investigate membrane fusion. (A) Graphical illustration of the EV uptake/cargo delivery pathway. (B) Comparison of the size distribution of EVs (red) and LUVs (black) measured via nanoparticle tracking analysis (NTA). (C) Representative cryo-TEM image of EVs isolated from OVCAR-3 cell supernatants and LUVs. Scale bar 100 nm. (D) Results of Fourier analysis performed on luminal region cryo-EM images, showing luminal region image and the average fast Fourier transform (FFT) obtained, alongside the FFT profile obtained for EVs (red) and LUVs (gray). Data are presented as average (open symbol) and SD (whiskers) obtained from n = 50 EVs and n = 50 LUVs from three separate imaging sessions. (E) Western blot analysis of density gradient fractions (pooled by density) and OVCAR-3 cell lysate (as a control) using antibodies against EV (Alix, CD9, and CD63) and control protein determinants (TOM20). Illustration created with BioRender.com.
