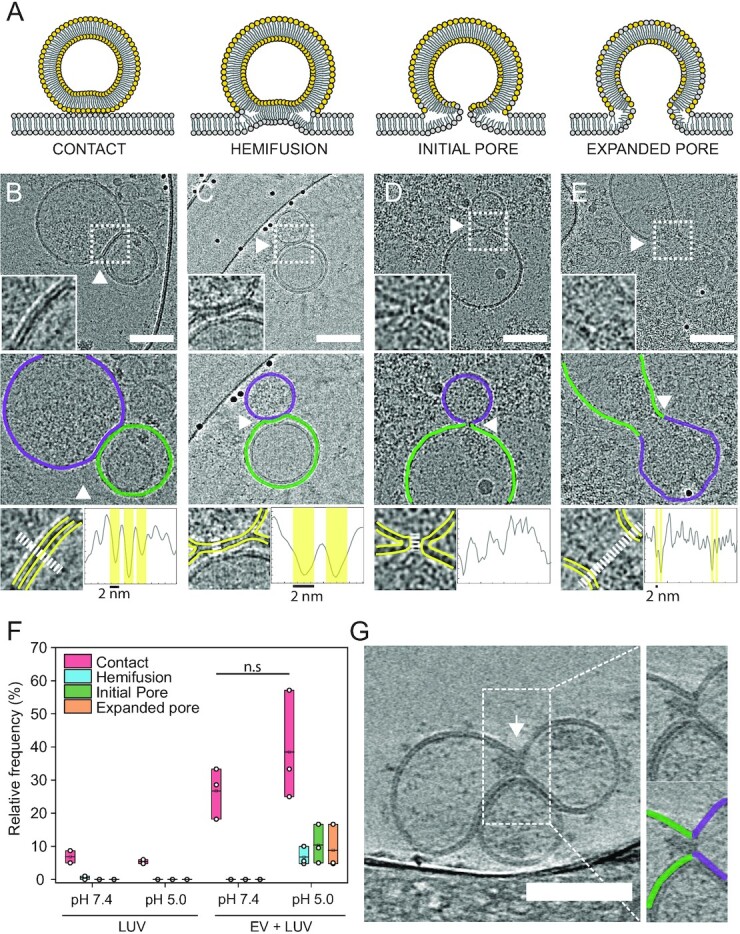
Fig. 4.

Cryo-EM imaging reveals EV hemifusion intermediates. (A) Illustration showing canonical viral membrane fusion intermediates. Contact: The membrane is tightly in contact (<2 nm) with the apposing membrane and the two bilayers run parallel to each other. Hemifusion: The two proximal leaflets of lipid bilayers have joined and the hemifusion diaphragm is composed of only the two remaining leaflets. Initial pore: The two membranes merge at the contact point, with the two bilayers transitioning continuously from one onto the other. At this stage, the content can mix, but the pores can still collapse and reseal. Expanded pore: The fusion pore increases in diameter and complete content mixing can occur. (B to E) Representative cryo-TEM images of vesicle–vesicle fusion intermediates. Insets show the interaction spot at higher magnification (top panel). Middle panel: outlines showing the two vesicles’ membranes defined by luminal gray level distribution. Bottom panel: line profile to evaluate the presence of bilayer-leaflets. Yellow and white lines indicate membrane leaflets in inset and region where line profile was acquired, respectively. (B) Contact between vesicles. (C) Hemifusion: arrow indicates the location where the two bilayers merged into one. (D) Initial pore: white arrow indicates the fusion pore. (E) Expanded pore: dumbbell-shaped pore with an enlarged neck and apparent cargo flow from one vesicle into the other. White arrow indicates the putative extended neck where the vesicles fused. (F) Quantification of interaction intermediates for LUV–LUV and EV–LUV systems at pH 7.4 and 5.0. (G) Tomographic reconstruction of vesicle–vesicle interaction at pH 5.0 revealing content mixing between the vesicles. White arrowhead indicates the fusion pore.
