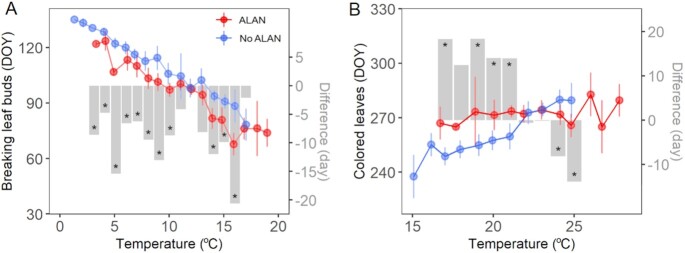
Fig. 2.
Differences in breaking leaf buds (A) and colored leaves (B) for sites with ALAN versus those without ALAN across temperatures. Points and error bars represent the mean and 95% CI of phenology (day of year) for each 1°C temperature increment. Gray bars represent the differences in phenology (days) by subtracting phenology at sites without ALAN from sites with ALAN. Statistical significance level at P < 0.05 is shown as an asterisk. The ALAN sites are those with higher than 75% quantile of ALAN among all sites (i.e. 19.1 nW/cm2/sr). Results based on bootstrapping method and alternative temperatures are shown in Figures S2 and S3 (Supplementary Material), respectively.

