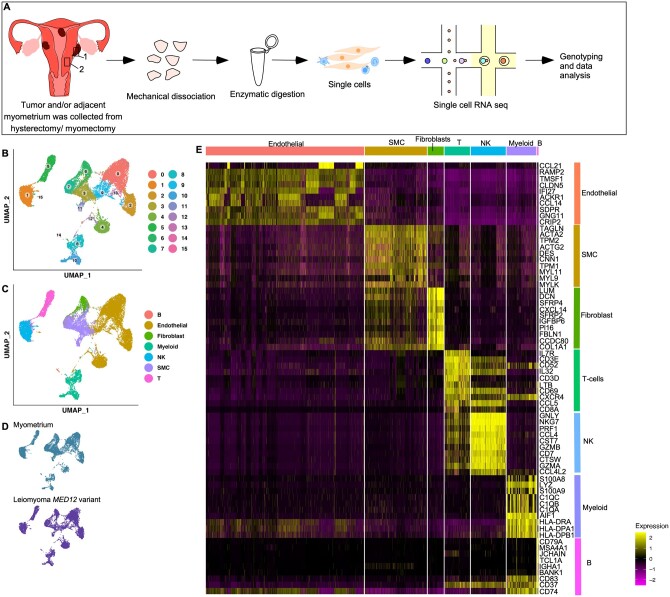
Figure 1.
Single-cell atlas of myometrium and leiomyomas. (A) Overview of the dissociation protocol for both myometrium (n = 5) and leiomyomas (n = 5). (B) Clustering of 24 605 high-quality cells from MED12-variant positive leiomyomas and myometrium. (C) Cell lineages identified by the marker gene expression. (D) Annotation of the cell clusters per sample. (E) Heatmap showing at least the top nine genes used for cluster identification. Columns denote cells; rows denote genes. SMC, smooth muscle cell; NK, natural killer cells; T, T cells; B, B cells.

