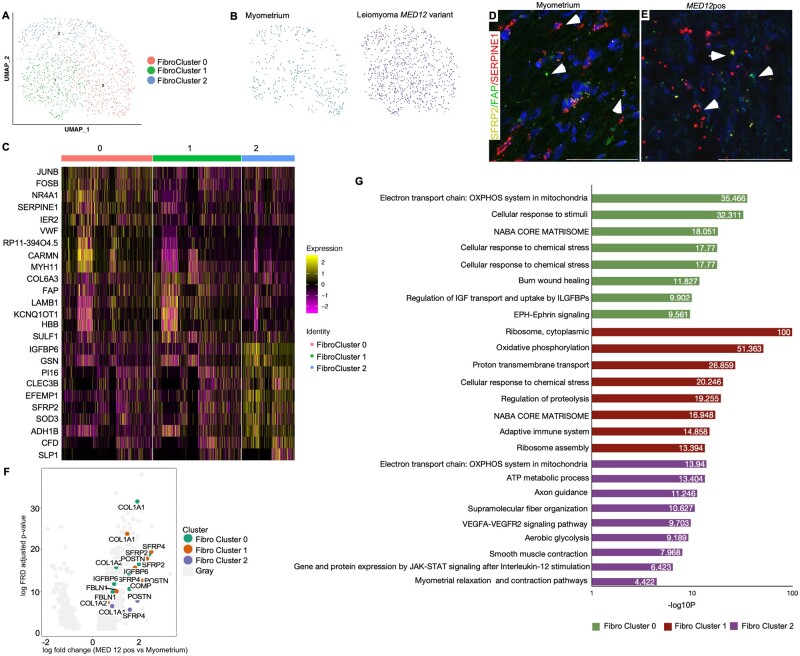
Figure 3.
Intracellular heterogeneity and transcriptomic changes in fibroblast population in MED12-variant positive leiomyomas compared to the myometrium. (A) Uniform Manifold Approximation and Projection on Principal (UMAP) components showing the clusters of 1197 fibroblast cells. (B) UMAP showing that all cell clusters are present in the myometrium and MED12-variant positive leiomyomas. (C) Heatmap of the fibroblast cell clusters. The colored bar on the top represents the cluster number. Columns denote cells; rows denote genes. (D, E) In-situ images showing the validation of fibroblast populations in the myometrium and MED12-variant positive leiomyomas. Scale bar is 50 µm. (F) Volcano plots showing the transcriptomic changes in the fibroblast cell clusters of MED12-variant positive cells compared to the myometrium. (G) Gene ontology (GO) analysis of DE genes showing at least 0.5-fold change in the MED12-variant positive leiomyomas as compared to the myometrium.

