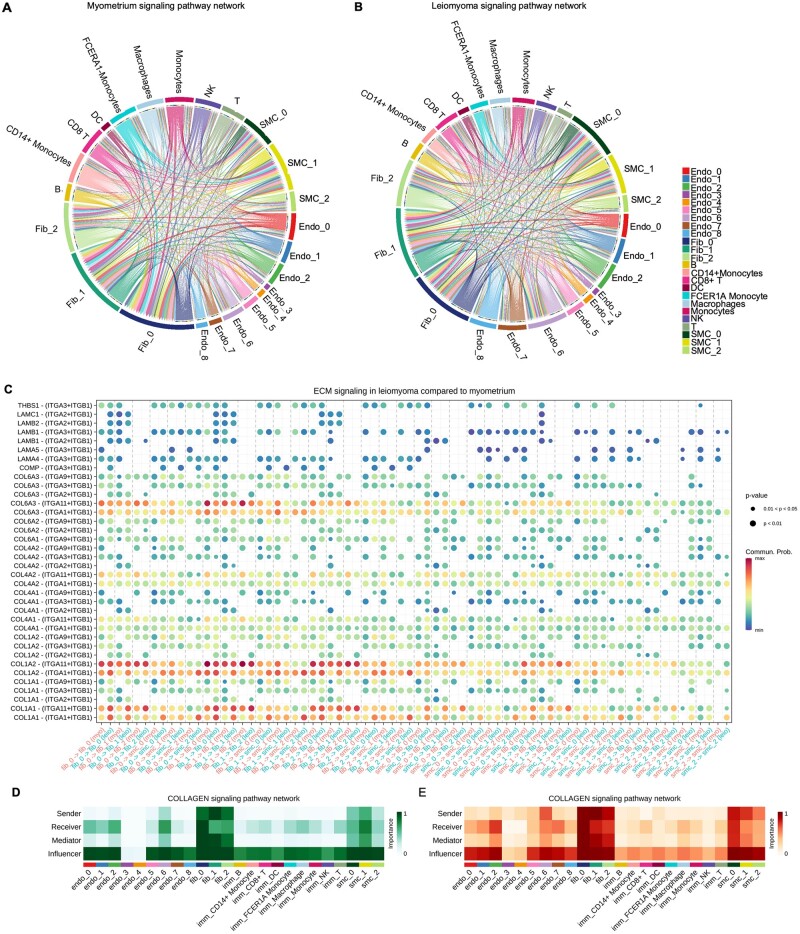
Figure 5.
Cell–cell communication in myometrium and leiomyomas. (A) Chord diagram showing the cell–cell interactions in myometrium. (B) Chord diagram showing cell–cell communication in MED12-variant positive leiomyomas. The perimeter of the chord diagram is color-coded by cellular subtype (colored outer arcs). The inner connecting lines show the interactions between target and receiver cell types. The connecting lines are color coded consistently with cellular subtypes. The thickness of each edge (edge weight) is proportional to the interaction strength. A thicker edge line indicates a stronger signal. (C) Dot plot showing the upregulated ECM signaling pathway receptor–ligand interactions in subcellular clusters. Color indicates the communication probability. Dot size indicates the P-value. (D, E) Heatmaps show the relative importance of each cell group based on the computed four network centrality measures of ECM signaling network in (D) myometrium and (E) leiomyoma.

