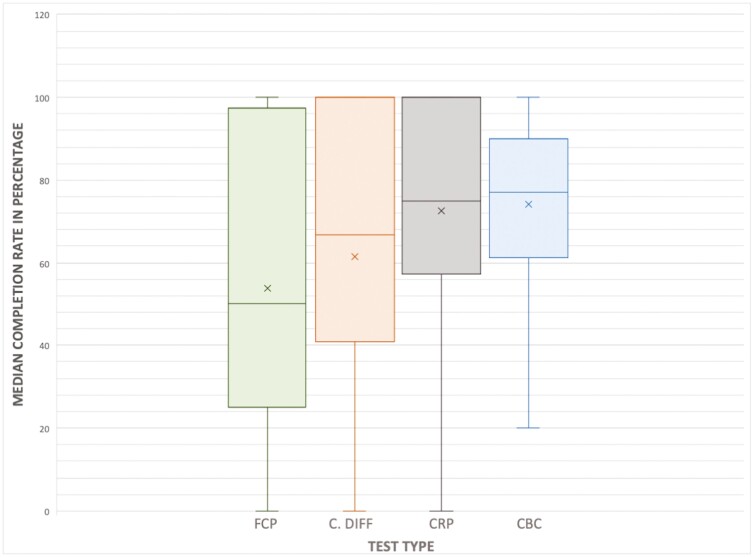
Figure 2.
Box-and-whisker plot displaying median completion rate per test type. FCP, fecal calprotectin; CRP, C-reactive protein; CBC, complete blood count. The median, or 50th percentile, is represented by the solid horizontal line per plot. Mean of the data is represented by an additional “x” symbol per plot.

