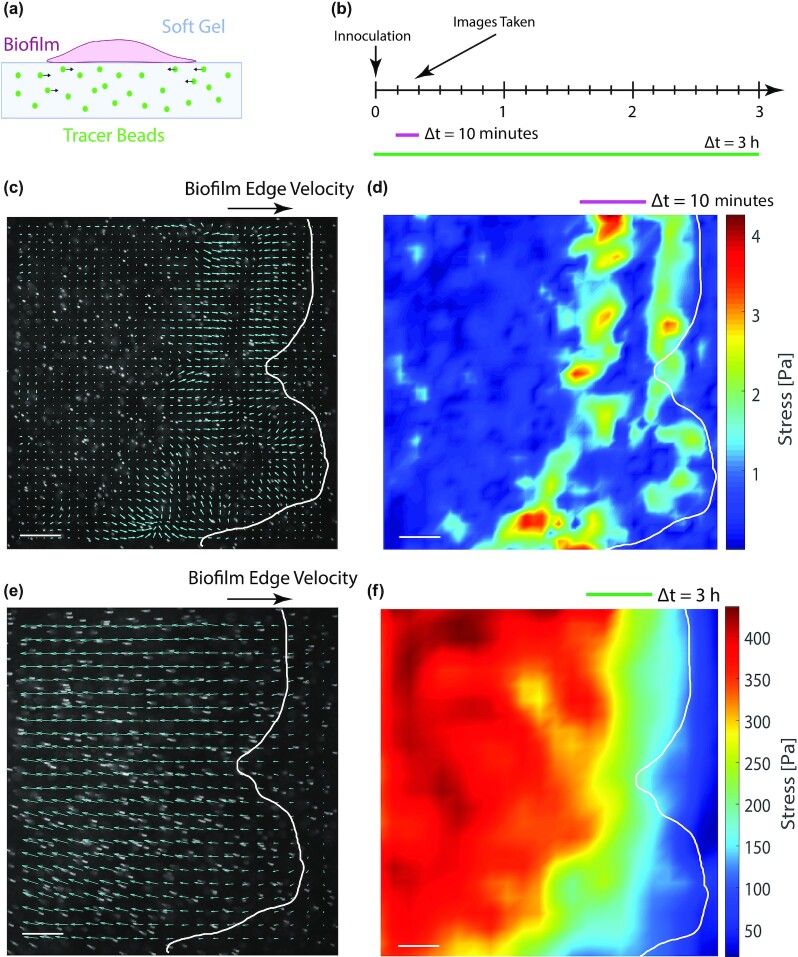
Fig. 6.
Serratia marcescens colonies exert collective time-dependent forces on their substrate. (a) Schematic of experimental set-up. Fluorescent tracers are embedded in the growth substrate underneath the colony. (b) Images are taken at 10-minute increments after inoculation up to 3 hours later. The displacement of the substrate is measured via particle imaging velocimetry (PIV; Methods), and the substrate displacement map depends on the time scale over which the video is observed (e.g. 10 minutes vs. 3 hours). (c) Over a relatively short time window (10 minutes) the displacement map and the (d) stress map show local regions of correlated motion near the expanding colony edge (overlaid in white). (e) Over longer time scales (3 hours), local fluctuations average out and there is a net drift of the particles toward the center of the colony, suggesting an inward contractile force. (f) The magnitude of the inner contractile force is much greater than the short-time fluctuations at the expanding edge. Data shown here is from a representative colony on a soft 0.5 kPa gel (3.5% PAA and 0.15% bis-crosslinker). Scale bar, 200 μm.

