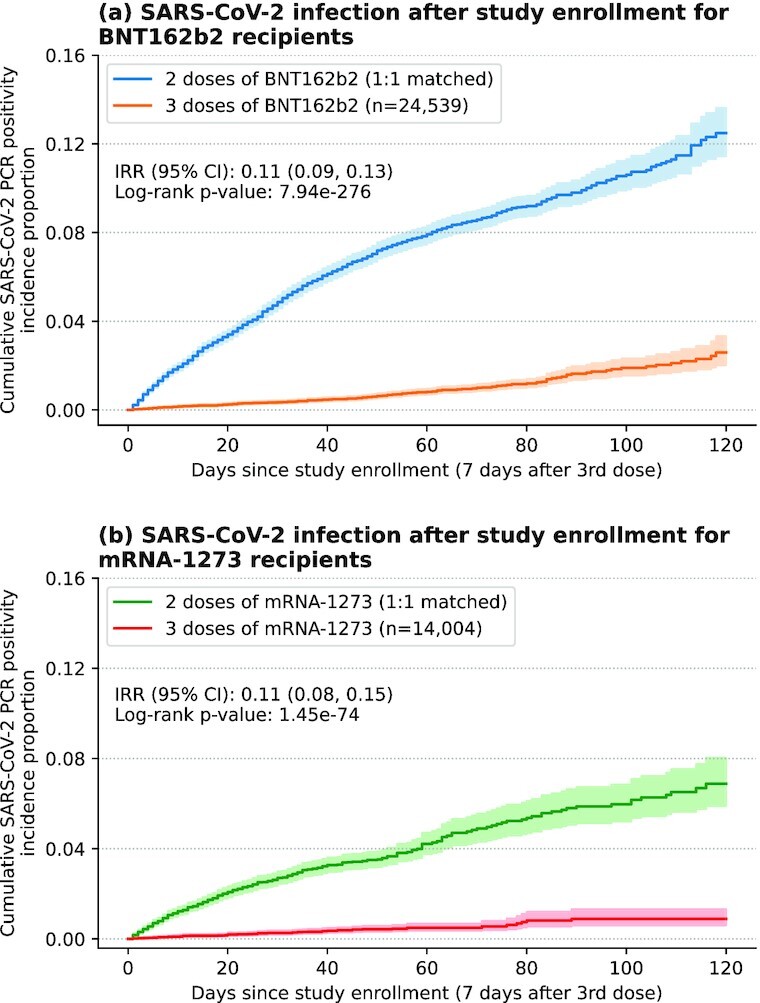
Fig. 2.

Kaplan–Meier analysis of the relative risk of SARS-CoV-2 infection. Shown is the cumulative incidence of positive SARS-CoV-2 PCR tests; (a) for 3-dose BNT162b2 recipients (orange) and their 1:1 matched 2-dose recipients (blue), and (b) for 3-dose mRNA-1273 recipients (red) and their 1:1 matched 2-dose recipients (green). Shaded regions correspond to 95% CI.
