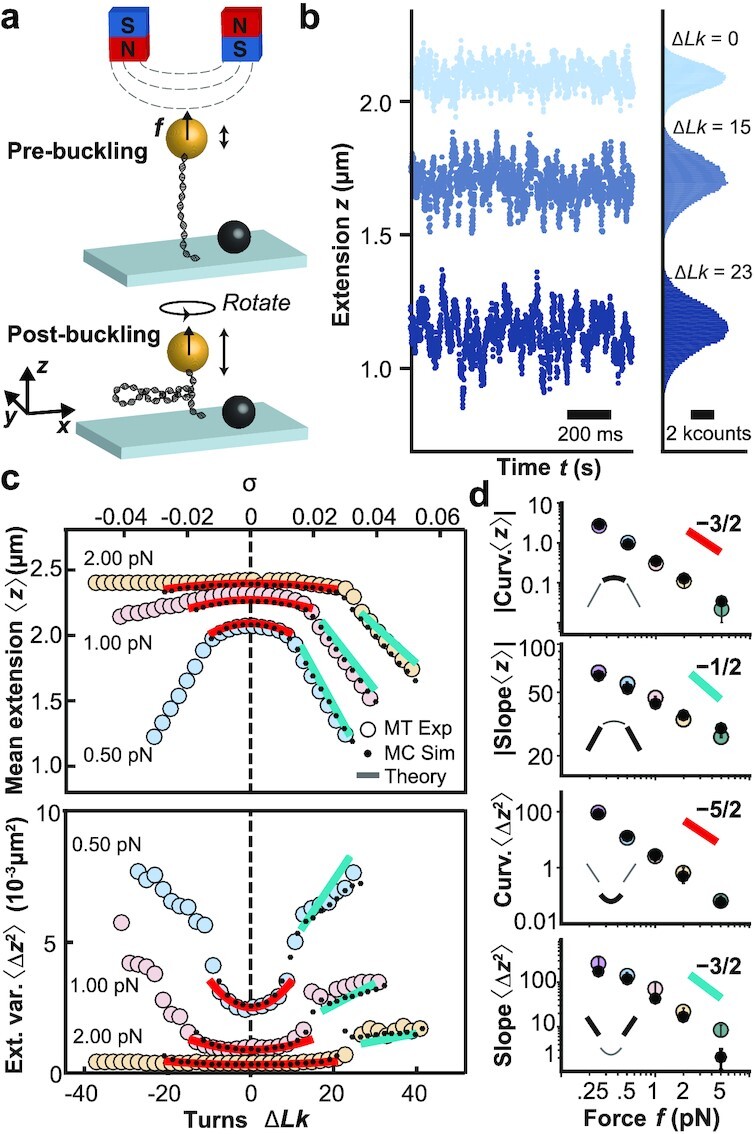
Fig. 1.

DNA extension fluctuation as a function of linking number and applied force. (a) Schematic of MT experiment applying forces and controlling the linking number of a DNA molecule tethered between a flow cell surface and a magnetic bead. (b) Time traces of experimentally measured extension z for three linking number differences ΔLk. The data show a decrease in 〈z〉 and an increase in 〈Δz2〉 when ΔLk is increased from the torsionally relaxed state ΔLk = 0. (c) MT experimental data for 〈z〉 and 〈Δz2〉 vs. ΔLk (or alternatively vs. the supercoiling density, σ ≡ ΔLk/Lk0, top axis) for three different forces, f = 0.5, 1, and 2 pN (large, colored circles). The small black circles and solid lines are predictions from Monte Carlo simulation and the analytical theories (see main text), respectively. (d) Curvatures in the prebuckling and of slopes in the postbuckling regimes for 〈z〉 and 〈Δz2〉 vs. applied force, f. The data are shown in double-logarithmic representation. Large colored circles are the mean ± std from at least eight independent measurements. Black dots are from Monte Carlo simulations, where error bars represent the uncertainty of the fit. According to the Moroz and Nelson (MN) model ((43) and Supplementary Material), the prebuckling curvatures of 〈z〉 and 〈Δz2〉 are expected to scale as f−3/2 and f−5/2 for large forces, respectively. The postbuckling slopes of 〈z〉 and 〈Δz2〉 are predicted to scale as f−1/2 and f−3/2.
