Fig. 2.

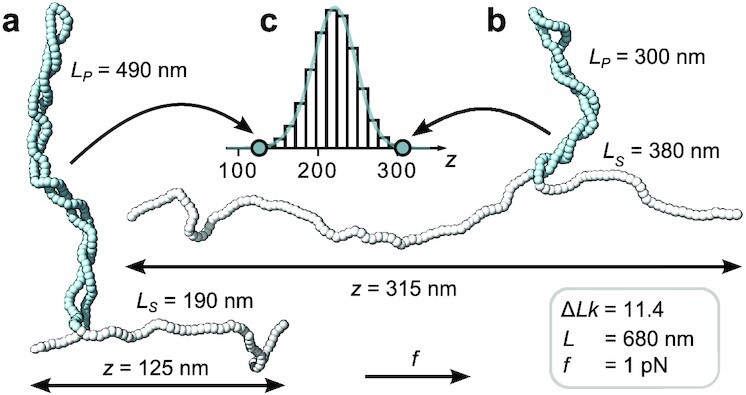
Monte Carlo simulations reveal extension fluctuation due to exchange of DNA length between the stretched and plectonemic states. (a,b) Snapshots of torsionally constrained and stretched linear DNA molecules in the post-buckling regime generated by a MC simulation (see "Methods" section). The molecule has a total length of L = 680 nm and is subjected to a stretching force of f = 1 pN while being maintained at fixed linking number ΔLk = 11.4 (corresponding to σ = 0.06). (c) Extension distribution from a single simulation run. The molecular configurations in (a) and (b) were chosen from opposite tails of the extension distribution in (c). In the low extension configuration (a) a significantly larger amount of contour length (Lp = 490 nm, blue segments) is contained in the plectonemic phase than in the high extension configuration (b), which exhibits a much more pronounced stretched phase (Ls = 380 nm, white segments). The simulations suggest that the exchange of DNA length between the plectonemic and stretched phases gives a major contribution to 〈Δz2〉.
