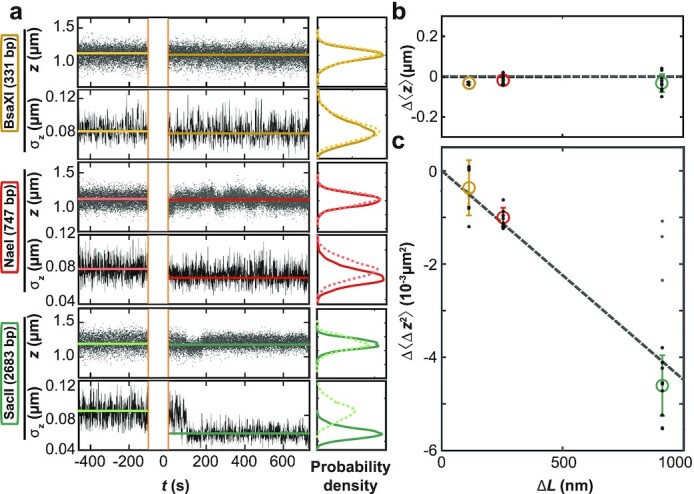
Fig. 4.

Effect of DNA bridging restriction enzymes on 〈z〉 and 〈Δz2〉 in MT. (a) Time traces for z and σz = (〈Δz2〉)1/2 measured in MT before and after addition of restriction enzymes at time t = 0. The restriction enzymes used are indicated on the left. Data for z are raw data recorded at 1 kHz. The standard deviation σz(t) was computed from z(t) using 1 s intervals. The histograms show the distribution of data points before (dashed lines) and after (solid lines) introduction of the proteins. (b) Change in mean extension Δ〈z〉 after protein binding as a function of expected loop length ΔL (Table 1). (c) Change in extension variance Δ〈Δz2〉 after protein binding vs. ΔL. The data in (b) and (c) are from at least five independent measurements for each enzyme. We quantified 〈Δz2〉 using the mean of the variance distributions. Black dots are individual measurements, colored circles and error bars the mean ± std over the independent measurements. The data show no substantial change in 〈z〉 and a drop in 〈Δz2〉 proportional to ΔL in agreement with Eq. (6), which is shown as a dashed line that is not a fit, but obtained from extrapolation of the experimental data (Fig. S6). A fraction of the experimental data points for the enzyme SacII deviate from the expected behavior (gray dots; excluded from further analysis), possibly indicating an alternative binding mode. All data shown were obtained at f = 0.5 pN and σ = 0.04.
