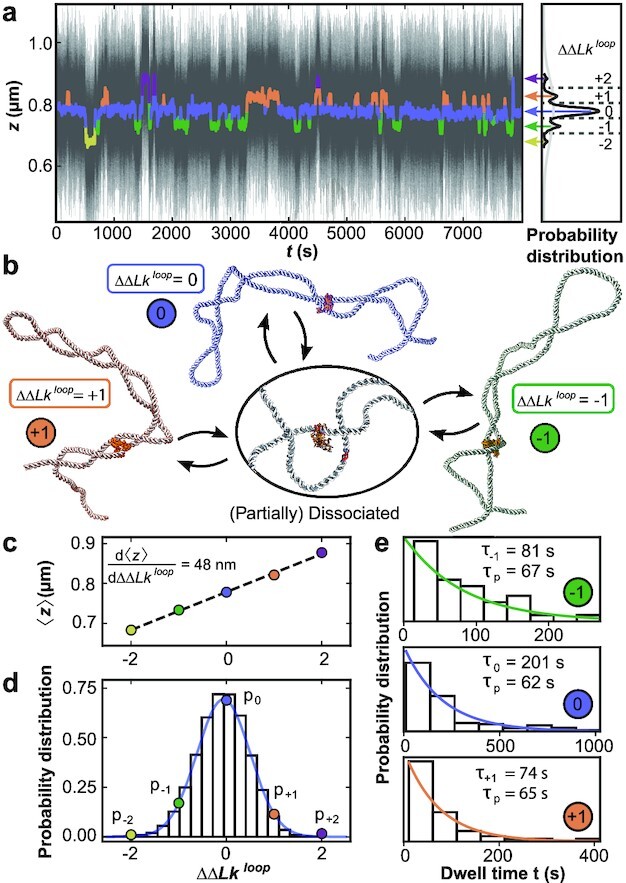
Fig. 5.

MT measurements reveal the dynamics of topological domains induced by DNA bridging NaeI. (a) Extension time trace in the presence of NaeI in Ca2 + buffer at f = 0.5 pN and σ = 0.04. The thin black lines are raw data at 1 kHz. Data filtered by a 10 s sliding average are shown as thick colored lines and exhibit clear transitions between different extension states. Extension states correspond to separate peaks in the extension histogram of the filtered trace on the right and are highlighted using different colors. (b) Illustration of different protein restrained states (crystal structure of NaeI from PDB ID: 1IAW (58)), as identified in panel a: partial protein dissociation and rebinding leads to sampling of states with different ΔΔLkloop and, consequently, different extensions. (c) Mean extension of the different states assigned in panel a as a function of their relative linking difference ΔΔLkloop. (d) Relative occupancy of the different extension states. The colored dots show the relative occupancy of the different levels observed experimentally and are well described by a Gaussian fit (blue line). The bars show the linking number distribution in plectonemic loops of the same size as the NaeI-induced loop generated with Monte Carlo simulations, with the mean shifted to zero. (e) Dwell time distributions for the three most populated states identified in panel (a). The data are well described by single exponentials (colored lines). The fitted mean dwell times for each state and the implied intrinsic lifetime τp are shown as insets.
