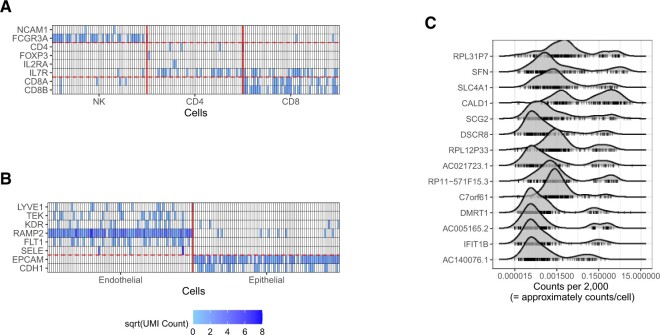
Figure 2.
(A) Markers in NK, CD4, and CD8 cells from blood show that some are unlikely to be observed. (B) Markers in endothelial and epithelial cells from lung. (C) Example of density plots of genes with bimodal expression distributions across cell and tissue types. Every tick mark represents the rate of that gene in a particular cell type or tissue type. The centers of the on and off distributions can be seen to vary by gene.

