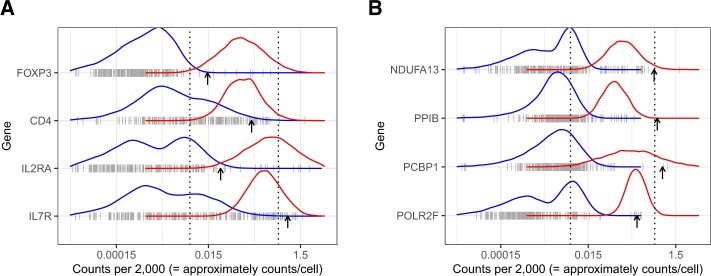
Figure 3.
Distributions of the rates of CD4 markers across cell- and tissue-types, against the fitted off and on components for each gene. Ticks show the rates of that gene in a particular cell- or tissue-type. Arrows indicate the rates in CD4 cells from the PBMC data set. (A) Four canonical CD4 markers. (B) Four CD4 markers we identified.

