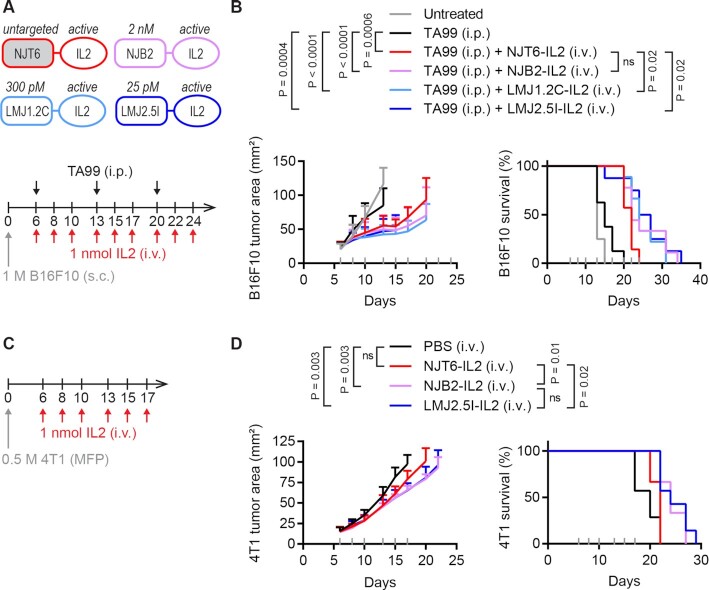
Fig. 3.
EIIIB-specific IL-2 immunocytokines lead to modest survival extension after intravenous administration. (A) Schematic of protein fusions (top) and B16F10 study timeline (bottom). Mice were inoculated with 1 M B16F10 cells subcutaneously (s.c.) in the right flank on day 0. Mice were treated on days indicated with 100 μg TA99 (i.p.) and 1 nmol (32 μg) IL-2 fusions (i.v.). (B) Tumor growth (left) and survival (right). Gray ticks above the x-axis mark treatment days. Tumor area (mean + SD) is shown until a mouse in that group is euthanized. Survival comparisons were generated by a log-rank Mantel–Cox test. ns, not significant. n = 7∼9. (C) 4T1 study timeline. Mice were inoculated with 0.5 M 4T1 cells in the mammary fat pad (MFP) on day 0 and treated on days indicated with 1 nmol (32 μg) IL-2 fusions (i.v.). (D) Tumor growth (left) and survival (right). Gray ticks above the x-axis mark treatment days. Tumor area (mean + SD) is shown until a mouse in that group is euthanized. Survival comparisons were generated by a log-rank Mantel–Cox test. ns, not significant. n = 6∼7.

