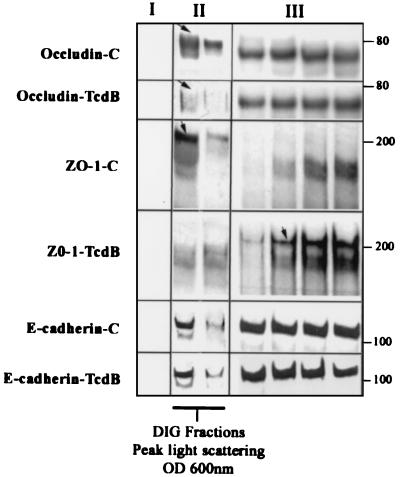
FIG. 6.
C. difficile toxin B influences the distribution of TJ proteins occludin and ZO-1 in TX-100-insoluble raft-like membrane microdomains. Sucrose gradient fractions from epithelial monolayers described in the legend to Fig. 5 were analyzed by immunoblotting for the TJ proteins occludin and ZO-1. Lanes I, II, and III represent fractions taken from the top of the gradient (<20% sucrose, one lane shown), peak light-scattering fractions (∼22% sucrose containing DIG fractions, two lanes shown), and representative fractions from the bottom of the gradients (>30% sucrose, four lanes shown), respectively. For occludin distribution; multiple bands ranging from 65 to 79 kDa were observed. While the low-molecular-mass species (∼65 to 71 kDa) was distributed in both the low- and high-density sucrose fractions, the high-molecular-mass species (∼72 to 79 kDa [arrow]) was observed in the low-density (∼22 to 24%) TX-100-insoluble sucrose fractions. Preexposure of epithelial monolayers to TcdB and disassembly of TJs resulted in a decrease in high-molecular-mass occludin in the light-scattering fractions. For ZO-1 distribution, Western blots of gradient fractions from control epithelial monolayers revealed a major pool of recoverable ZO-1 in raft-containing low-density fractions (panel II, arrow) compared to the high-density fractions in the bottom of the gradient. Following exposure to TcdB (80 ng/ml for 2 h), ZO-1 redistributed predominantly to the high-density sucrose fractions (panel III, arrow). A broad nonspecific band at ∼150 to 170 kDa that does not represent ZO-1 staining was observed with the Zymed polyclonal antibody raised to a ZO-1 fusion protein. E-cadherin was distributed in both the low-density (panel II) and high-density (panel III) fractions, a pattern that was not influenced by the Tcd toxin. The above results are representative results from four individual experiments. OD 600nm, optical density at 600 nm.

