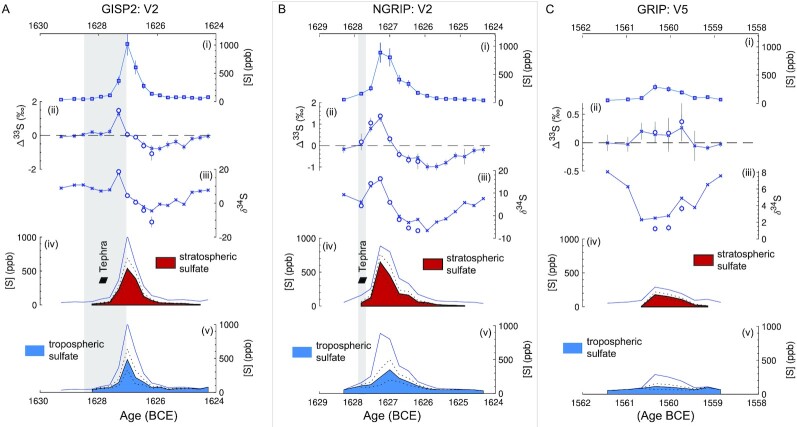
Fig. 5.
Sulfur concentration, isotopes, and proportion of stratospheric and tropospheric sulfur from V2 in the GISP2 (A) and NGRIP (B) and V5 in GRIP (C). Each panel illustrates: (i) sulfur concentration (ppb), (ii) measured Δ33S in all samples (x’s) as well as Δ33S of volcanic sulfate (o’s), corrected for background sulfate with isotope mass balance for samples with greater than 65% sulfate derived from volcanic sources (see Methods), (iii) same as (ii) but for δ34S, (iv) sulfate concentration with the calculated proportion of sulfate deposited via the stratosphere (red), and (v) same as (iv) but blue denotes sulfate that remained below the ozone (mix of background and volcanic sulfate from low atmospheric altitudes). Dotted lines show uncertainties. Tephra shards were found between NGRIP 641.16 and 641.08 m in this study (1627.9 to 1627.9 BCE, see gray vertical bands) partially overlaping in depth with QUB-1198. QUB-1201 (not replicated here), was found between 641.50 and 641.70 m (1631.7 to 1630.5 equivalent).

