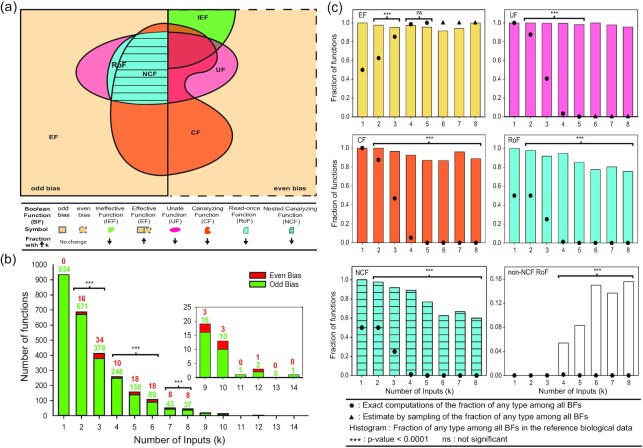
Fig. 2.
(a) In the space of all BFs, a schematic of the overlaps between different types of biologically meaningful BFs with 4 inputs. This figure is not drawn to scale but the sizes of the sets corresponding to different types of BFs and their intersections respect the order of the actual values. The legend gives the correspondence between shapes with specific color and the different types of BFs. Ordering the different types of BFs with 4 inputs (which are not mutually exclusive) based on their sizes in a descending order gives: EF > Odd bias = Even bias > CF > UF > RoF > NCF. The up (or down) arrows in the legend depict the increase (or decrease) in the fraction of BFs that belong to a specific type as k increases (see Table S2 (Supplementary Material) for the exact numbers). (b) The in-degree distribution for nodes in the reference biological dataset. (c) The plots show the abundance and statistical significance of the biologically meaningful BFs for k ≤ 8 in the reference biological dataset. The dot symbols which appear to coincide with the x-axis are very small nonzero numbers (except for non-NCF RoFs with k = 1, 2, and 3).

