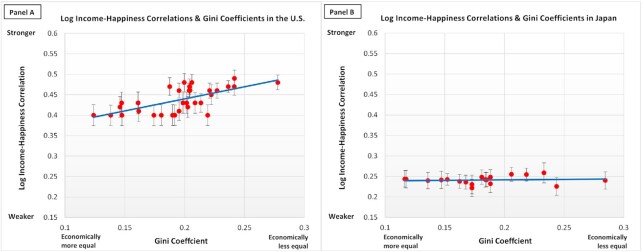
Fig. 2.
The log income–happiness correlation by the Gini coefficient in the USA and in Japan.
Note. The x-axis indicates the Gini coefficient. The y-axis is the correlation between the log of income and happiness (Fisher z-transformed). The error bar indicates the SE of the log income–happiness correlation. The blue line depicts the total trend (USA: y = 0.5921x + 0.3215, R2 = 0.4281; Japan: y = 0.0232x + 0.237; R2 = 0.010).

