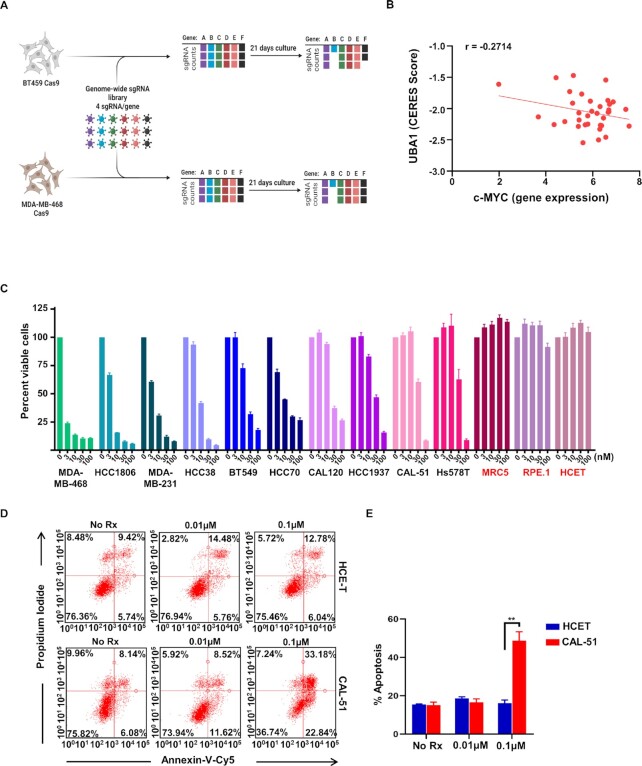
Fig. 1.
UBA1 is a target in TNBC. (A) Schema of the TNBC genetic screen. Whole genome of the TNBC cell lines (BT-549 and MDA-MB-468) was followed by UBA1 depletion in nine TNBC cell lines. Created with BioRender.com (B) Graph shows a strong negative correlation (r = −0.2714) between the CERES score from targeting the UBA1 gene in CRISPR knock-out cells and c-MYC expression obtained in various BC models (C) Graph represents % of viable cells assessed by CellTiter-Glo in TNBCs and normal tissue-derived MRC5, human retinal pigment epithelial-1 (RPE-1), and human corneal epithelial cell-transfrmed (HCE-T) cells (red) following 72-h treatment with TAK-243 at the indicated concentration. (D) Flow cytometric analysis showing annexin-V-Cy5 and propidium iodide staining in HCE-T and CAL-51 cells following 24-h treatment with TAK-243 at the indicated concentration. (E) The graph represents % of apoptosis assessed by flow cytometry in HCE-T and CAL-51 cells following 24-h treatment with TAK-243 at the indicated concentration. Error bars are SEM n = 3 and **P < 0.01.

