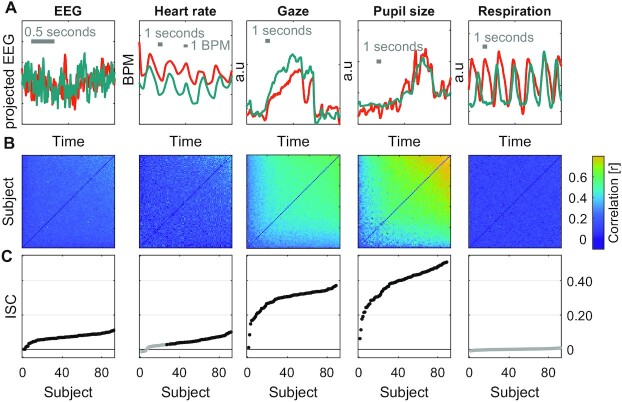
Fig. 1.
ISC of neural, physiological, and behavioral signals during passive video watching. (A) Signals for each of the modalities simultaneously recorded during Experiment 1. The 2 subjects shown (green and orange) have the highest ISC values measured for each modality. The EEG signal is the first component extracted from the 64-channel EEG using correlated component analysis. The gaze position signal is the horizontal gaze position. (B) Pearson correlation matrix between all pairs of the 92 subjects for each of the modalities. Subjects are sorted by increasing average correlation values. The correlation matrix for gaze position is the average correlation of gaze position in the horizontal and vertical direction. The correlation matrix for EEG is the sum of the correlation values obtained for 9 components extracted with correlated component analysis. (C) ISC values are the average of pairwise correlations for each subject, i.e. the mean over column of the correlation matrix in (B), excluding the diagonal, and averaged over the 3 videos presented (10 minutes total duration). Subjects are ordered by their ISC values (same as in B). Filled points indicate statistically significant ISC values and nonfilled points indicate they are not statistically significant. Statistical significance is determined using circular shuffle statistics (10,000 shuffles and corrected for multiple comparisons with FDR of 0.01). Circular shuffle means that the signal of each subject is randomly shifted in time, thus removing any intersubject relation.

