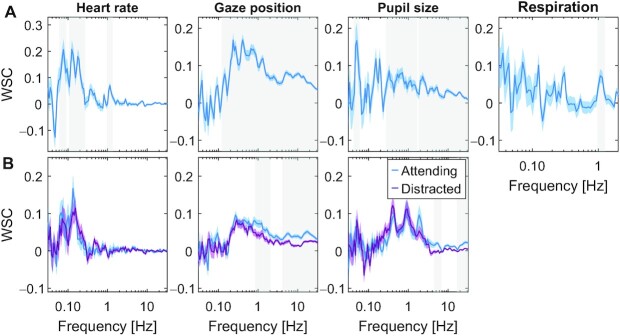
Fig. 6.
Within-subject coupling between EEG and other signal modalities during viewing of videos. WSC between EEG and gaze position, pupil size, HR, and respiration. The WSC is computed as the correlation between each signal modality and spatially filtered EEG. The spatial filters are found as the least square fit of scalp electrode potentials with the respective signal modality (computed separately for each frequency band; see supplement for variation across bands). (A) WSC computed by combining the 3 stimuli used in Experiment 1. Blue-shaded area indicates SEM over subjects. Gray-shaded frequency-band indicates significant difference from 0 (P < 0.01, N = 92 subjects, and cluster corrected t test on test data). (B) WSC values are computed separately for the attentive and distracted viewing conditions. WSC values are the average across the 5 stimuli used in Experiment 2 with N = 29 subjects, and the shaded area around the average WSC values is the SEM over subjects. Gray-shaded frequency range indicates a significant difference between attending and distracted conditions (P < 0.01, paired t test N = 29, and cluster corrected).

