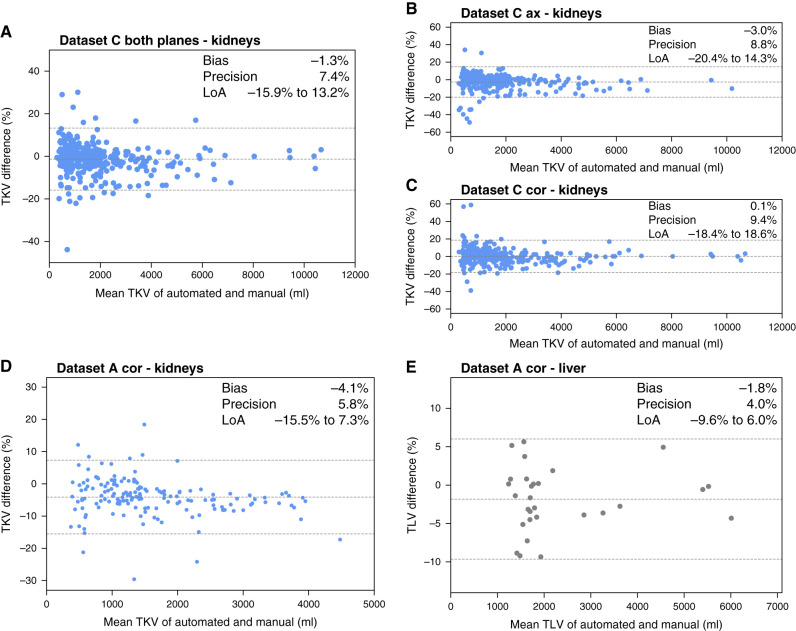
Figure 5.
External validation of the automated model shows that it generalizes well across various MRI scanners and protocols. Bland–Altman plots for assessing the difference between TKV and TLV calculated from the automated segmentation and reference volumetry method of manual tracing for the external data. (A)–(C) present results for kidney volumetry in dataset C, and (D) and (E) present results for kidney and liver volumetry, respectively, in the coronal MRI series of dataset A.

