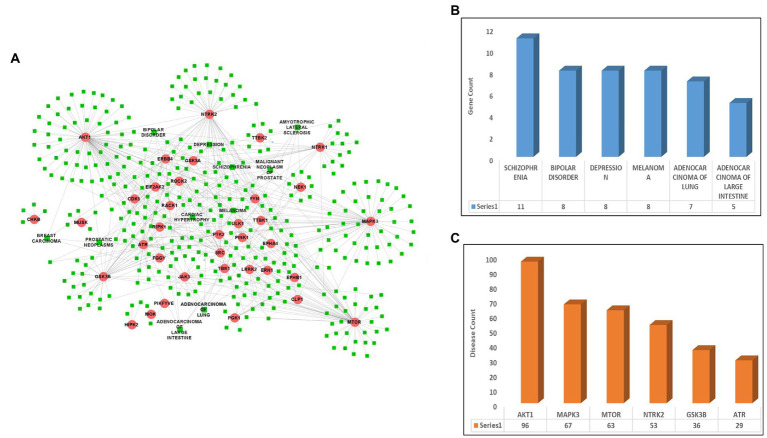
Figure 1.
Disease-kinase interaction network. (A) ALS-associated 36 Kinases (Red) show interaction with the human diseases along with ALS (Green). (B) Bar plot representing the highest number of genes associated with the disease. (C) Bar plot representing the highest number of diseases associated with the genes.

