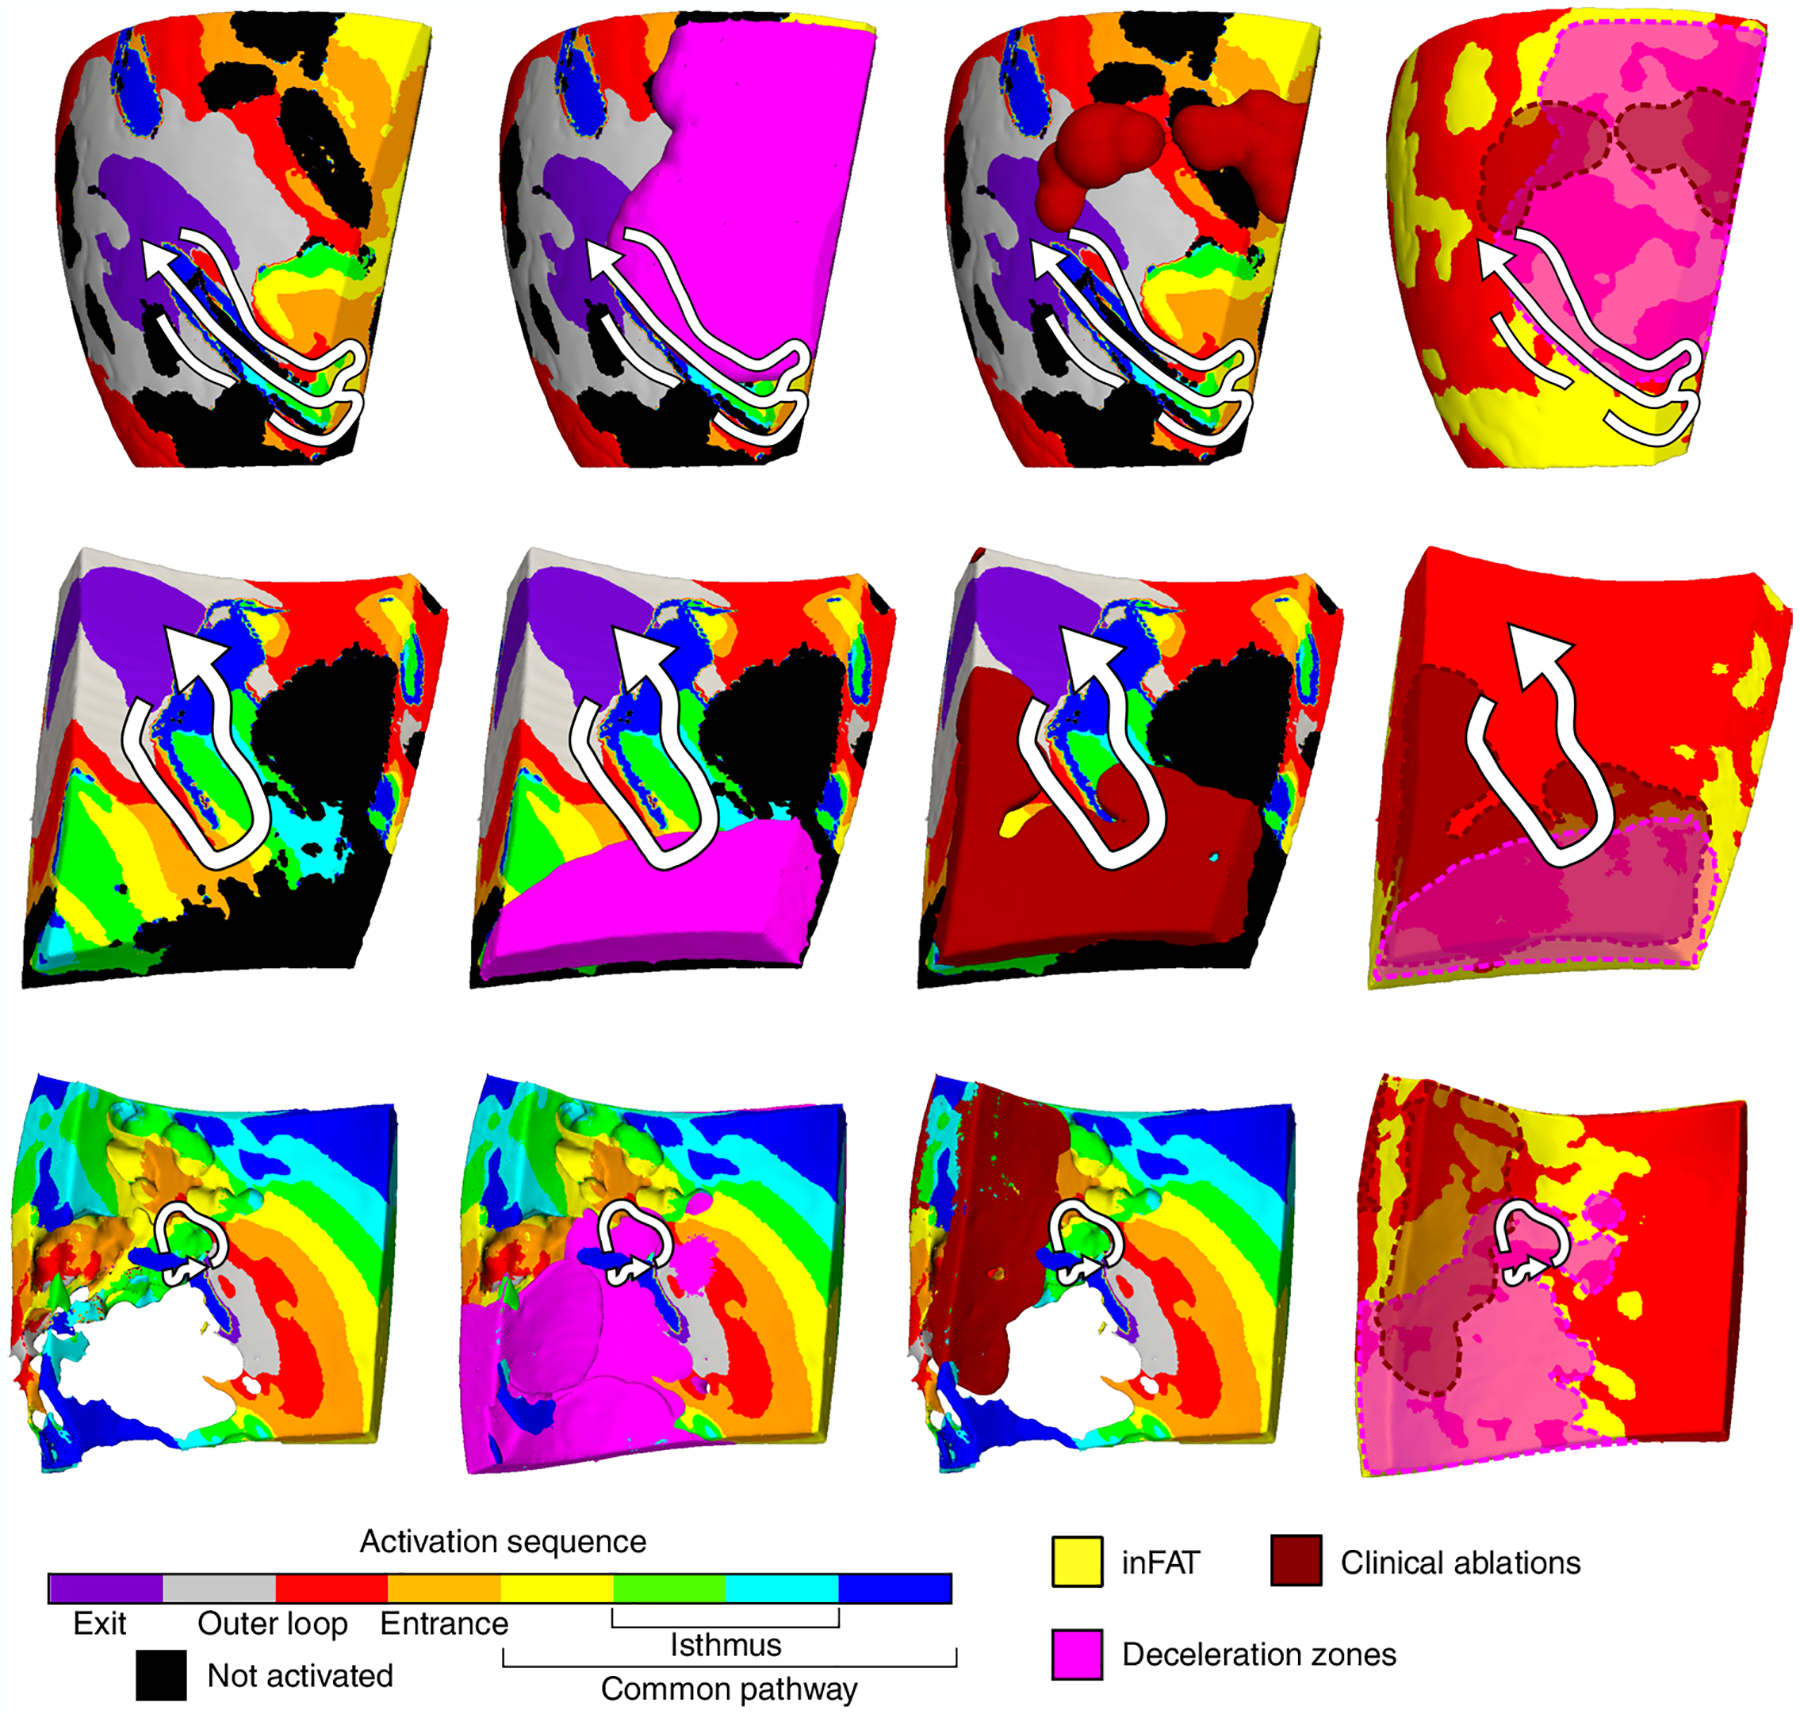
Fig. 6 |. inFAT promotes conduction abnormalities in critical sites of the VT circuitry.

Three examples of VT circuits in hybrid CT-MRI heart models with the overlapping clinical ablations and DZs are displayed. For these three VT circuits, there was inFAT but little to no fibrosis present. Arrows trace the re-entrant pathway from the exit site to the end of the common pathway. The pink regions denote the DZs, and the dark red denotes the estimated volume of the ablation lesion. Non-activated tissues were omitted for the bottom VT circuit to better visualize the intramural activation sequence.
