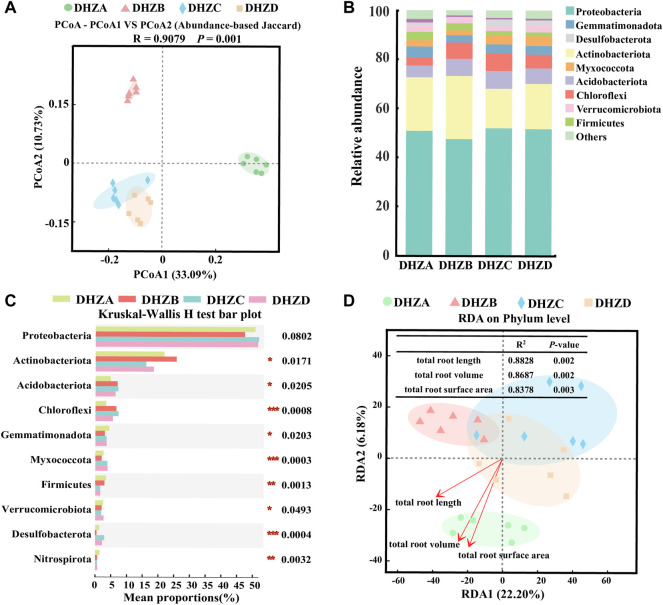
FIGURE 3.
Bacterial beta diversity and microbiome composition analysis. (A) Principal coordinate analysis (PCoA) using the Abundance-based Jaccard distance matrix. (B) Relative abundance of different phyla in rhizosphere soil samples from plants of different sugarcane root rot severity. (C) Kruskal–Wallis H test analysis showing bacteria at the phylum level. *p < 0.05, **p < 0.01, ***p < 0.001. (D) Redundancy analysis (RDA) of rhizosphere bacterial community (dot) and root phenotype (arrows) indicates influential root phenotype factors.

