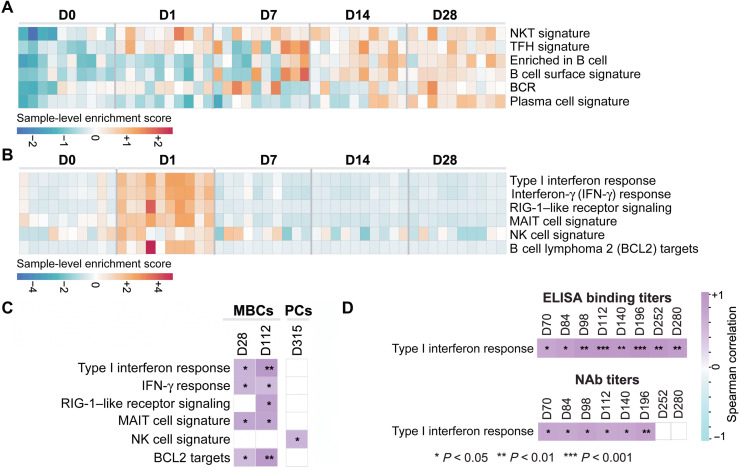
Fig. 5. Innate immune signatures correlated with durable antibody responses.
(A) Heatmaps show the row scaled sample-level enrichment (SLE) scores of natural killer T (NKT), T follicular helper (Tfh), B cell, BCR, and PC signatures on days 0, 1, 7, 14, and 28 after single-shot Ad26.COV2.S vaccination. (B) Heatmaps show the row scaled SLE scores of innate pathways up-regulated on day 1 after single-shot Ad26.COV2.S vaccination. (C) Correlation between SLE scores of pathways up-regulated on day 1 after single-shot Ad26.COV2.S vaccination and RBD-specific MBCs or PCs after vaccination. Columns correspond to individual animals, and rows correspond to individual pathways. Purple color gradient indicates the Z score–normalized SLE of each pathway across animals, measured as the mean expression of pathway leading genes (BH-adjusted P < 0.05) for each individual animal. (D) Spearman correlation of type I IFN signature SLE score and binding or neutralizing antibody titers is shown for multiple time points. Spearman correlation coefficients range from cyan (negative correlation) to purple (positive correlation). Blank squares indicate no significance. *P < 0.05, **P < 0.01, and ***P < 0.001.

