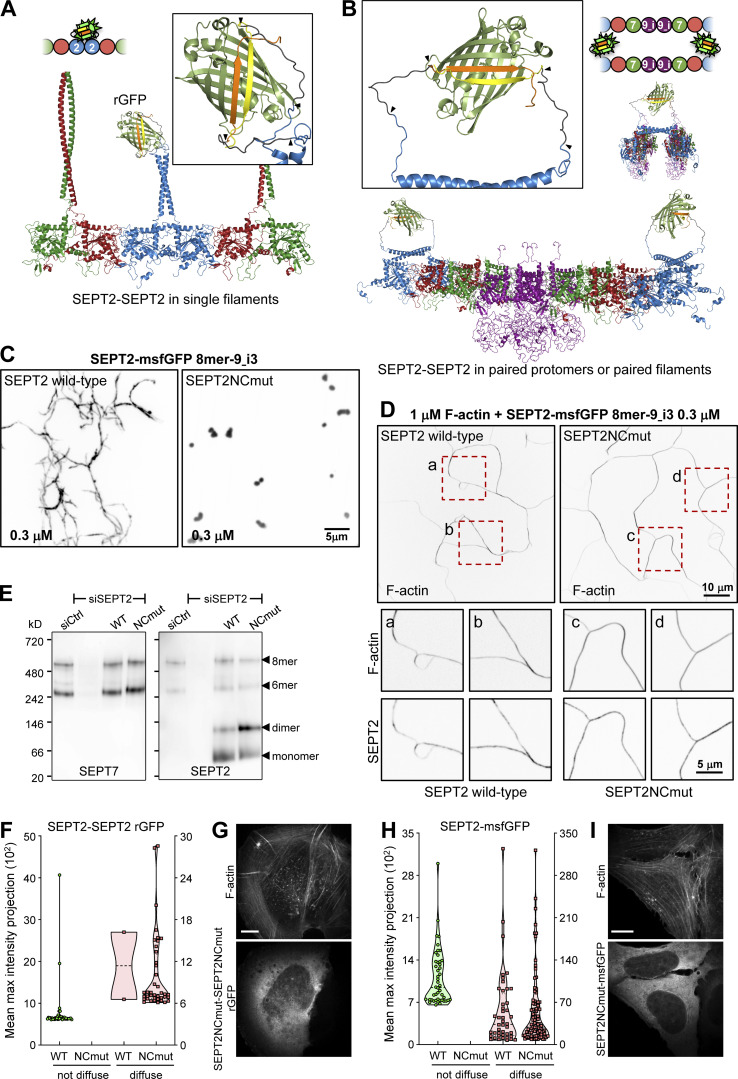
Figure 2.
All septins on SFs organize as filaments. (A and B) Structure models of rGFP through direct SEPT2-SEPT2 interactions of two polymerizing septin protomers within a filament (A) or from SEPT2 in two apposed protomers (B). Only the end-to-end interacting halves of the protomers (hexamers or/and octamers) are shown in A for simplicity. SEPT6 and SEPT7 coiled-coils are not shown in B for simplicity. The transparency of the terminal SEPT2 subunits in B is used to suggest that the paired protomers could be found within a filament. β10 and β11 strands are shown in yellow and orange, respectively. Linker sequences between septins and the β-strands, delimited by arrowheads, are shown in dark gray. The colors of septin subunits in the structure models correspond to the ones in the color-coded sphere representation of hexamers and octamers. The second half of the octamer is not shown in the rotated filament pair in B for the sake of simplicity. (C) Representative spinning disk fluorescence images of septin filament assembly upon polymerization of octamers-9_i3 in solution at the indicated final protomer concentration. Protomers contained either wild-type SEPT2 (left panel) or SEPT2NCmut (right panel). Images use an inverted grayscale. (D) Representative spinning disk fluorescence images of reconstituted actin filaments, polymerizing in the presence of septin octamers in solution. Protomers contained either wild-type SEPT2 (left panel) or SEPT2NCmut (right panel). Actin filaments are visualized with AlexaFluor568-conjugated phalloidin, and septins with SEPT2-msfGFP. One example of large fields of view are shown for each condition, depicting cross-linking of actin filaments; only actin labeling is shown. Insets on the bottom show higher magnifications of selected regions of interest on the top (dashed squares in red). Two regions of interest (a and b for wild-type SEPT2 and c and d for SEPT2NCmut) are shown in each case, depicting both the actin (top row) and septin (bottom row) signals. Scale bars in all large fields of views, 10 μm. Scale bars in all insets, 5 μm. (E) Western blot following native PAGE of U2OS cell lysates probed with anti-SEPT7 (left) and anti-SEPT2 (right) antibodies upon treatment with siRNAs targeting LacZ (siCtrl), SEPT2 (siSEPT2), and targeting SEPT2 while expressing wild-type SEPT2-msfGFP (WT) or SEPT2NCmut-msfGFP (NCmut). Molecular weight markers are shown on the left. The overexpression of the msfGFP fusions leads to SEPT2 monomers and dimers in addition to hexamers and octamers (arrowheads). (F) Violin plots depicting the distribution of diffuse cytosolic (red datapoints) vs. non-diffuse (green datapoints) phenotypes as a function of the intensity of the rGFP signal in GFP1-9 cells co-expressing wild-type SEPT2-β10 and -β11 or SEPT2NCmut-β10 and -β11. Data points are from a total of 40 cells each for wild-type and mutant SEPT2 distributed among the two phenotypes. (G) Representative example of a GFP1-9 cell co-expressing SEPT2NCmut-β10 and -β11 and co-stained for F-actin (phalloidin) showing a diffuse cytosolic phenotype. Scale bar, 10 μm. (H) Violin plots depicting the distribution of diffuse cytosolic (red datapoints) vs. non-diffuse (green datapoints) phenotypes as a function of the intensity of the msfGFP signal in cells expressing wild-type SEPT2-msfGFP or SEPT2NCmut-msfGFP. Data points are from a total of 90 cells each for wild-type and mutant SEPT2 distributed among the two phenotypes. (I) Representative example of a cell expressing SEPT2NCmut-msfGFP and co-stained for F-actin (phalloidin) showing a diffuse cytosolic phenotype. Scale bar, 10 μm. Source data are available for this figure: SourceData F2.

