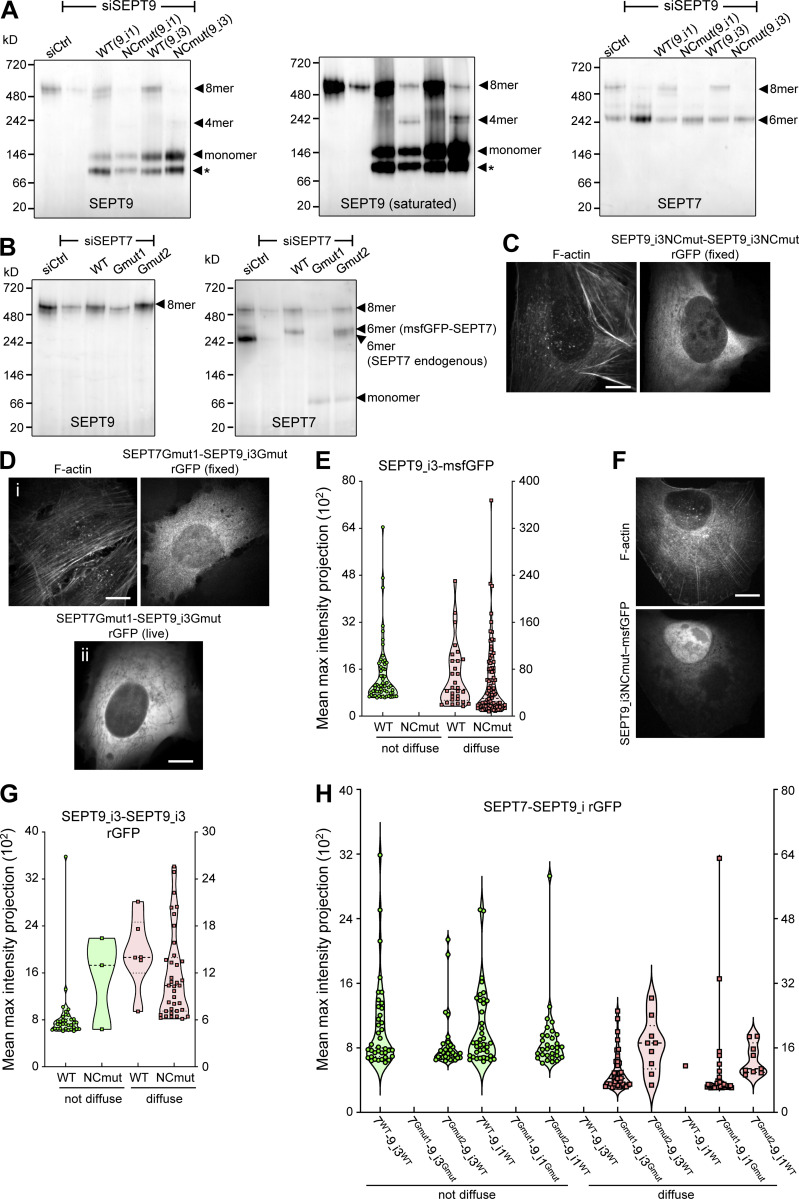
Figure 4.
Intact SEPT9 NC and G interfaces are required for septin localization to SFs. (A) Western blot following native PAGE of U2OS cell lysates probed with anti-SEPT9 (left and middle) and anti-SEPT7 (right) antibodies upon treatment with siRNAs targeting LacZ (siCtrl), SEPT9 (siSEPT9), and targeting SEPT9 while expressing wild-type SEPT9-msfGFP (WT) or SEPT9NCmut-msfGFP (NCmut) for both SEPT9_i1 and SEPT9_i3. The SEPT9 blot is also shown saturated on purpose for displaying weaker bands. Arrowheads point to the sizes of the indicated complexes. The asterisks point to SEPT9 degradation. Molecular weight markers are shown on the left. (B) Western blot following native PAGE of U2OS cell lysates probed with anti-SEPT9 (left) and anti-SEPT7 (right) antibodies upon treatment with siRNAs targeting LacZ (siCtrl), SEPT7 (siSEPT7), and targeting SEPT7 while expressing wild-type msfGFP-SEPT7 (WT), msfGFP-SEPT7Gmut1 (Gmut1), or msfGFP-SEPT7Gmut2 (Gmut2). Arrowheads point to the sizes of the indicated complexes. Molecular weight markers are shown on the left. (C) Representative example of a GFP1-9 cell co-expressing SEPT9_i3NCmut-β10 and -β11, co-stained for F-actin (phalloidin), showing a diffuse cytosolic phenotype. Scale bar, 10 μm. (D) Representative examples of a fixed (i) and a live (ii) GFP1-9 cell co-expressing β11-SEPT7Gmut1 and SEPT9_i3Gmut-β10 showing a diffuse cytosolic phenotype. The fixed cell is co-stained for F-actin (phalloidin). Scale bar, 10 μm. (E) Violin plots depicting the distribution of diffuse cytosolic (red datapoints) vs. non-diffuse (green datapoints) phenotypes as a function of the intensity of the msfGFP signal in cells expressing wild-type SEPT9_i3-msfGFP or SEPT9_i3NCmut-msfGFP. Data points are from a total of 90 cells each for wild-type and mutant SEPT9 distributed among the two phenotypes. (F) Representative example of a cell expressing SEPT9_i3NCmut-msfGFP, co-stained for F-actin (phalloidin), showing a diffuse cytosolic phenotype. Scale bar, 10 μm. (G) Violin plots depicting the distribution of diffuse cytosolic (red datapoints) vs. non-diffuse (green datapoints) phenotypes as a function of the intensity of the rGFP signal in GFP1-9 cells co-expressing wild-type SEPT9_i3-β10 and -β11 or SEPT9_i3NCmut-β10 and -β11. Data points are from a total of 40 cells each for wild-type and mutant SEPT9 distributed among the two phenotypes. (H) Violin plots depicting the distribution of diffuse cytosolic (red datapoints) vs. non-diffuse (green datapoints) phenotypes as a function of the intensity of the rGFP signal in GFP1-9 cells co-expressing the indicated combinations of β11-SEPT7 and SEPT9-β10 fusions. Data points are from a total of 40 cells each for each combination, distributed among the two phenotypes. Source data are available for this figure: SourceData F4.

