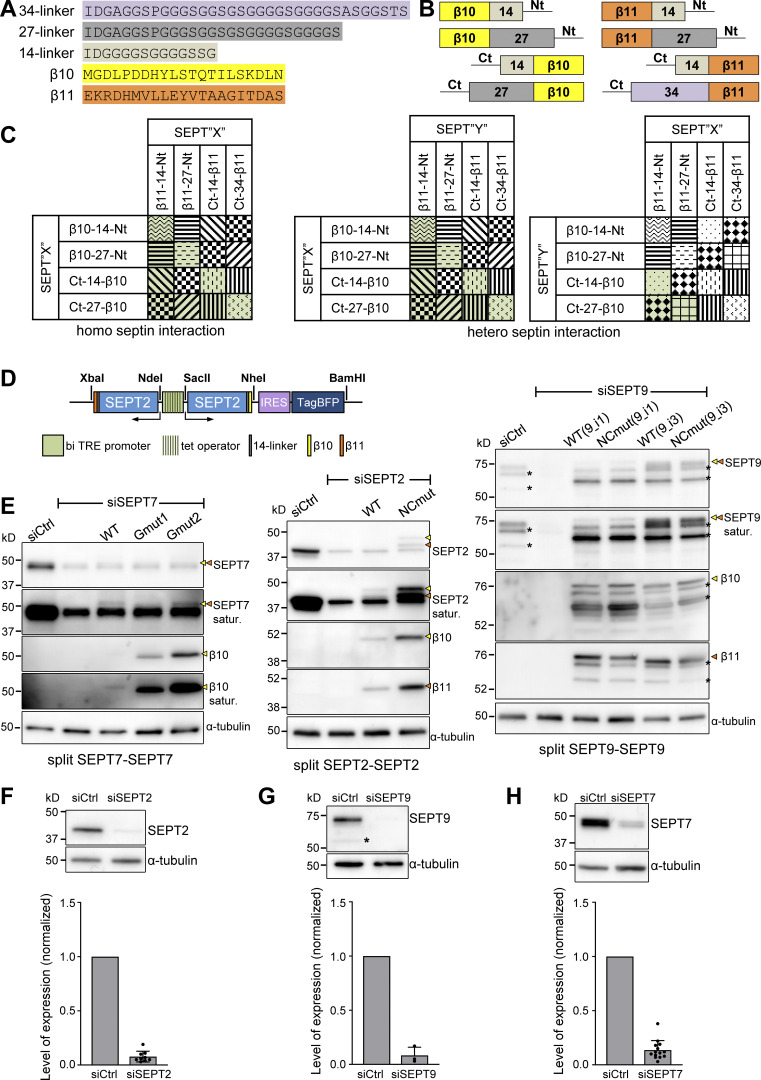
Figure S2.
Design of the tripartite split-GFP complementation assay for probing septin organization. (A) Sequences of the β10- and β11-tags used for all split assays and of the linker sequences tested in screening experiments (B and C); 14-residue linkers were used throughout this study. (B) Schematic of N- and C-terminal β10- and β11-tag septin fusions tested in screening experiments (C) using short or long linkers (A). (C) Schematic of β10- and β11-septin fusion combinations for screening tripartite split GFP complementation. Combinations with the same pattern were considered to be equivalent (for example, SEPT2-14-β10/β11-14-SEPT2 and SEPT2-14-β11/β10-14-SEPT2). The combinations in green are the ones tested experimentally. (D) Schematic of the pTRIP TRE Bi vector bearing a bidirectional tetracycline response element (TRE) promoter for the doxycycline-inducible co-expression of β10- and β11-tagged septins. An IRES-TagBFP cassette was used for monitoring septin expression. Restriction sites used for subcloning are indicated (see methods for details). (E) Left: Western blots of U2OS-Tet-On-GFP1-9 cell line lysates probed with anti-SEPT7, anti-β10 and anti-α-tubulin antibodies upon treatment with siRNAs targeting LacZ (siCtrl), SEPT7 (siSEPT7), and targeting SEPT7 while co-expressing wild-type β10- and β11-SEPT7 (WT), β10- and β11-SEPT7Gmut1 (Gmut1), and β10- and β11-SEPT7Gmut2 (Gmut2). Yellow and orange arrowheads point to bands correspond to β10- and β11-fusions. The SEPT7 and β10 blots are also shown saturated on purpose for displaying weaker bands. Molecular weight markers are shown on the left. Middle: Western blots of U2OS-Tet-On-GFP1-9 cell line lysates probed with anti-SEPT2, anti-β10, anti-β11, and anti-α-tubulin antibodies upon treatment with siRNAs targeting LacZ (siCtrl), SEPT2 (siSEPT2), and targeting SEPT2 while co-expressing wild-type SEPT2-β10 and -β11 (WT) or SEPT2NCmut-β10 and -β11 (NCmut). Yellow and orange arrowheads point to bands correspond to β10- and β11-fusions. The SEPT2 blot is also shown saturated on purpose for displaying weaker bands. Right: Western blots of U2OS-Tet-On-GFP1-9 cell line lysates probed with anti-SEPT9, anti-β10, anti-β11, and anti-α-tubulin antibodies upon treatment with siRNAs targeting LacZ (siCtrl), SEPT9 (siSEPT9), and targeting SEPT9 while co-expressing wild-type SEPT9-β10 and -β11 (WT) or SEPT9NCmut-β10 and -β11 (NCmut) for both SEPT9_i1 and SEPT9_i3. Yellow and orange arrowheads point to bands correspond to β10- and β11-fusions. The SEPT9 blot is also shown saturated on purpose for displaying weaker bands. Asterisks point to SEPT9 degradation products. (F) Western blot of U2OS cell lysates probed with anti-SEPT2 and anti-α-tubulin antibodies upon treatment with siRNAs targeting LacZ (siCtrl) or SEPT2 (siSEPT2). Molecular weight markers are shown on the left. Bottom, respective quantification of SEPT2 protein levels (mean + SD). Mean values (normalized to 1 for siCtrl) are from three independent siCtrl and nine independent siSEPT2 treatments. SEPT2 was knocked down on average by 92%. (G) Same as F for SEPT9. The asterisk points to a SEPT9 degradation product. Mean values (normalized to 1 for siCtrl) are from three independent siCtrl and three independent siSEPT9 treatments. SEPT9 was knocked down on average by 92%. (H) Same as F for SEPT7. Mean values (normalized to 1 for siCtrl) are from 3 independent siCtrl and 12 independent siSEPT7 treatments. SEPT7 was knocked down on average by 86%. Source data are available for this figure: SourceData FS2.

