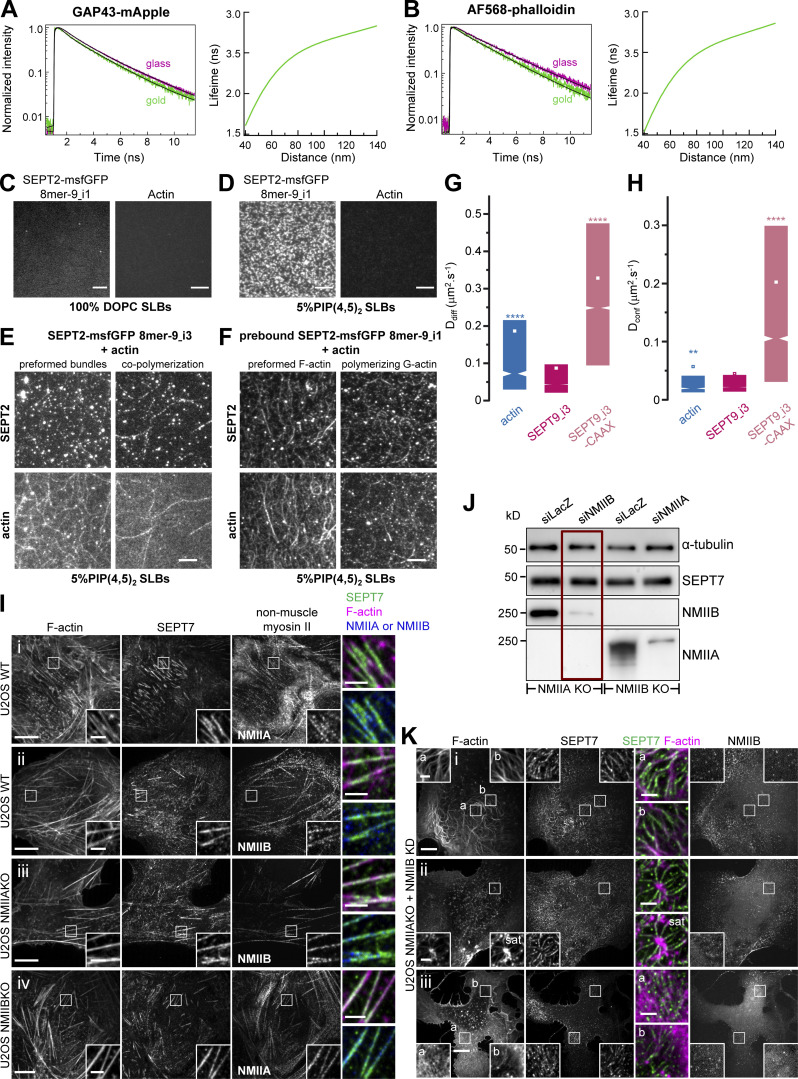
Figure S5.
Septin filaments are closely apposed to the plasma membrane, are immobilized on actin stress fibers, and can mediate actin-membrane anchoring in the absence of myosin-II. (A and B) depict representative examples of lifetime decay traces for GAP43-mApple (A, left) and AF568-phalloidin (F-actin; B, left) on glass and in the presence of gold. The solid lines represent the numerical fits, showing the lifetime reduction due to the MIET process. The respective calculated lifetime-distance dependences, used to calculate the distances of the fluorophores from the coverslip (Fig. 10 E) are shown in the respective right panels. Related to Fig. 10, B–E. (C and D) TIRF images of SEPT2-msfGFP 8mer-9_i1 alone (left) or F-actin alone (right) on top of a supported lipid bilayer (SLB) composed of 100% DOPC (C) or 5% PI(4,5)P2 and 95% DOPC (D). Scale bar, 5 μm. Related to Fig. 10 F. (E) TIRF images of SEPT2-msfGFP 8mer-9_i3 and F-actin, either co-polymerized on top of an SLB, or co-polymerized in solution to form preformed bundles that were then flushed onto the supported lipid bilayer. The supported lipid bilayer was composed of 5% of PI(4,5)P2, a septin-interacting lipid, and 95% DOPC. Scale bar, 5 μm. Related to Fig. 10 F. (F) TIRF images of SEPT2-msfGFP 8mer-9_i1 prepolymerized on top of a supported lipid bilayer (SLB), with actin added in a second step to the membrane-bound septin filaments, either as prepolymerized actin filaments or as G-actin. The supported lipid bilayer was composed of 5% PI(4,5)P2 and 95% DOPC. Scale bar, 5 μm. Related to Fig. 10 F. (G and H) Box plots displaying the median (notch) and mean (square) ± percentile (25–75%) of diffusion coefficients corresponding to the free diffusion (Ddiff) (G) and confined diffusion (Dconf) (H) trajectories outside FAs from sptPALM. Related to Fig. 10, G–K. Statistical significance was obtained using two-tailed, non-parametric Mann–Whitney rank sum test. The different conditions were compared to the SEPT9_i3-mEos3.2 condition. The resulting P values are indicated as follows: ** P < 0.01; **** P < 0.0001. (I) Representative confocal micrographs of U2OS cells co-stained for F-actin (phalloidin), SEPT7 and non-muscle myosin heavy chain isoforms IIA (NMIIA) or IIB (NMIIB). Wild-type U2OS cells were co-stained for either NMIIA (i) or NMIIB (ii). NMIIA KO U2OS cells were co-stained for NMIIB (iii). NMIIB KO U2OS cells were co-stained for NMIIA (iv). (J) Western blot of NMIIA KO and NMIIB KO U2OS cell lysates probed with anti-α-tubulin, anti-SEPT7, anti-NMIIA and anti-NMIIB antibodies. NMIIA KO cells were treated either with LacZ or NMIIB siRNA. NMIIB KO cells were treated either with LacZ or NMIIA siRNA. Molecular weight markers are shown on the left. The condition shown with the red rectangle corresponds to the images shown in K. (K) Representative confocal micrographs of NMIIA KO U2OS cells (i–iii) treated with NMIIB siRNA and co-stained for F-actin (phalloidin), SEPT7 and NMIIB. Scale bars in large fields of views, 10 μm. Scale bars in insets, 2 μm. Source data are available for this figure: SourceData FS5.

