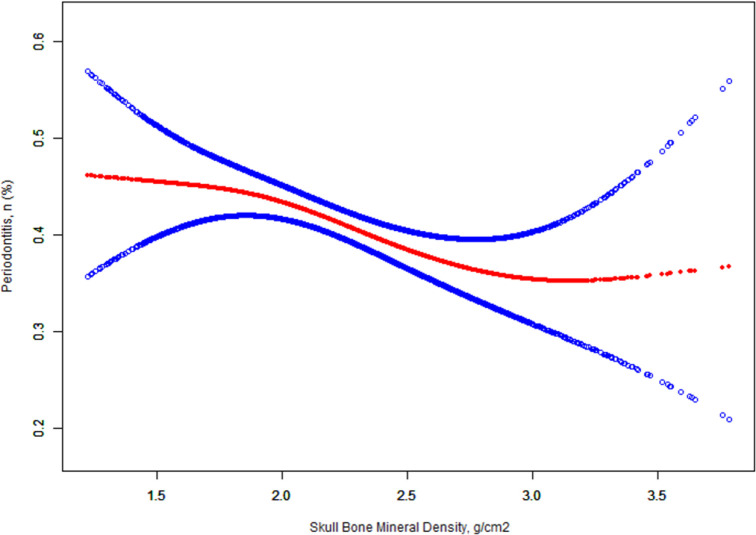
Fig 1. Dose-response relationship between skull BMD and periodontitis*.
Solid lines represent smooth curve fitting between variables. The dotted line represents 95 of the fitted confidence interval. *Adjusted for sex; age(smooth); race; education level; PIR; BMI; handgrip strength; smoke consumption; alcohol consumption; hypertension; hypertriglyceridemia; diabetes; general health condition; depressive symptoms; hours of sleep; frequency of interdental hygiene (last 7 days).

