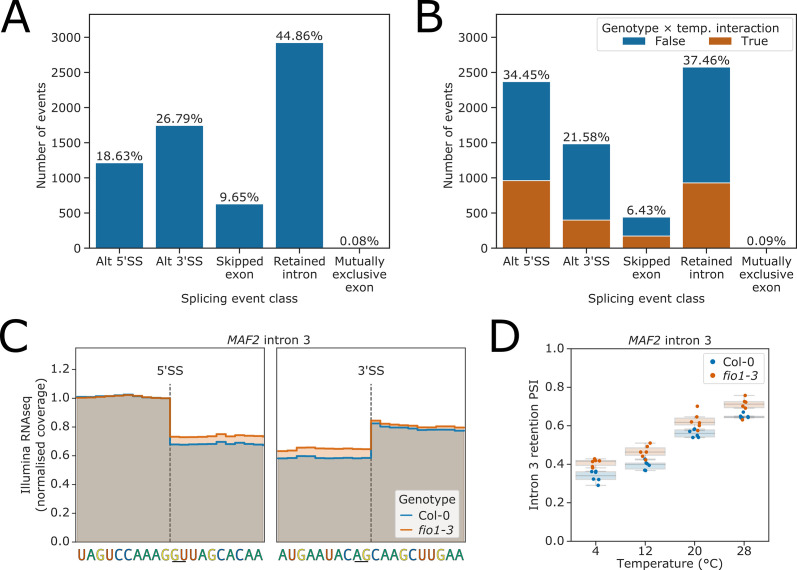
Figure 3. Splicing events sensitive to temperature and loss of FIO1.
(A–B) Analysis of Illumina RNA-seq data presented as bar plots showing the proportion of splicing events of each class, as labelled by SUPPA, which have significantly different usage (false discovery rate [FDR] <0.05) at either (A) varying temperatures or (B) in fio1-3. In (B), events for which the response to temperature changes in fio1-3 are shown in orange. (C) Gene track of Illumina RNA-seq reads showing the change in retention of MAF2 intron 3 in fio1-3, at 20°C. Expression is normalised by the read coverage at the −1 position of the 5’ splice site (5’SS). (D) Boxplot of Illumina RNA-seq analysis showing the change in retention of MAF2 intron 3 at varying temperatures and in fio1-3.


