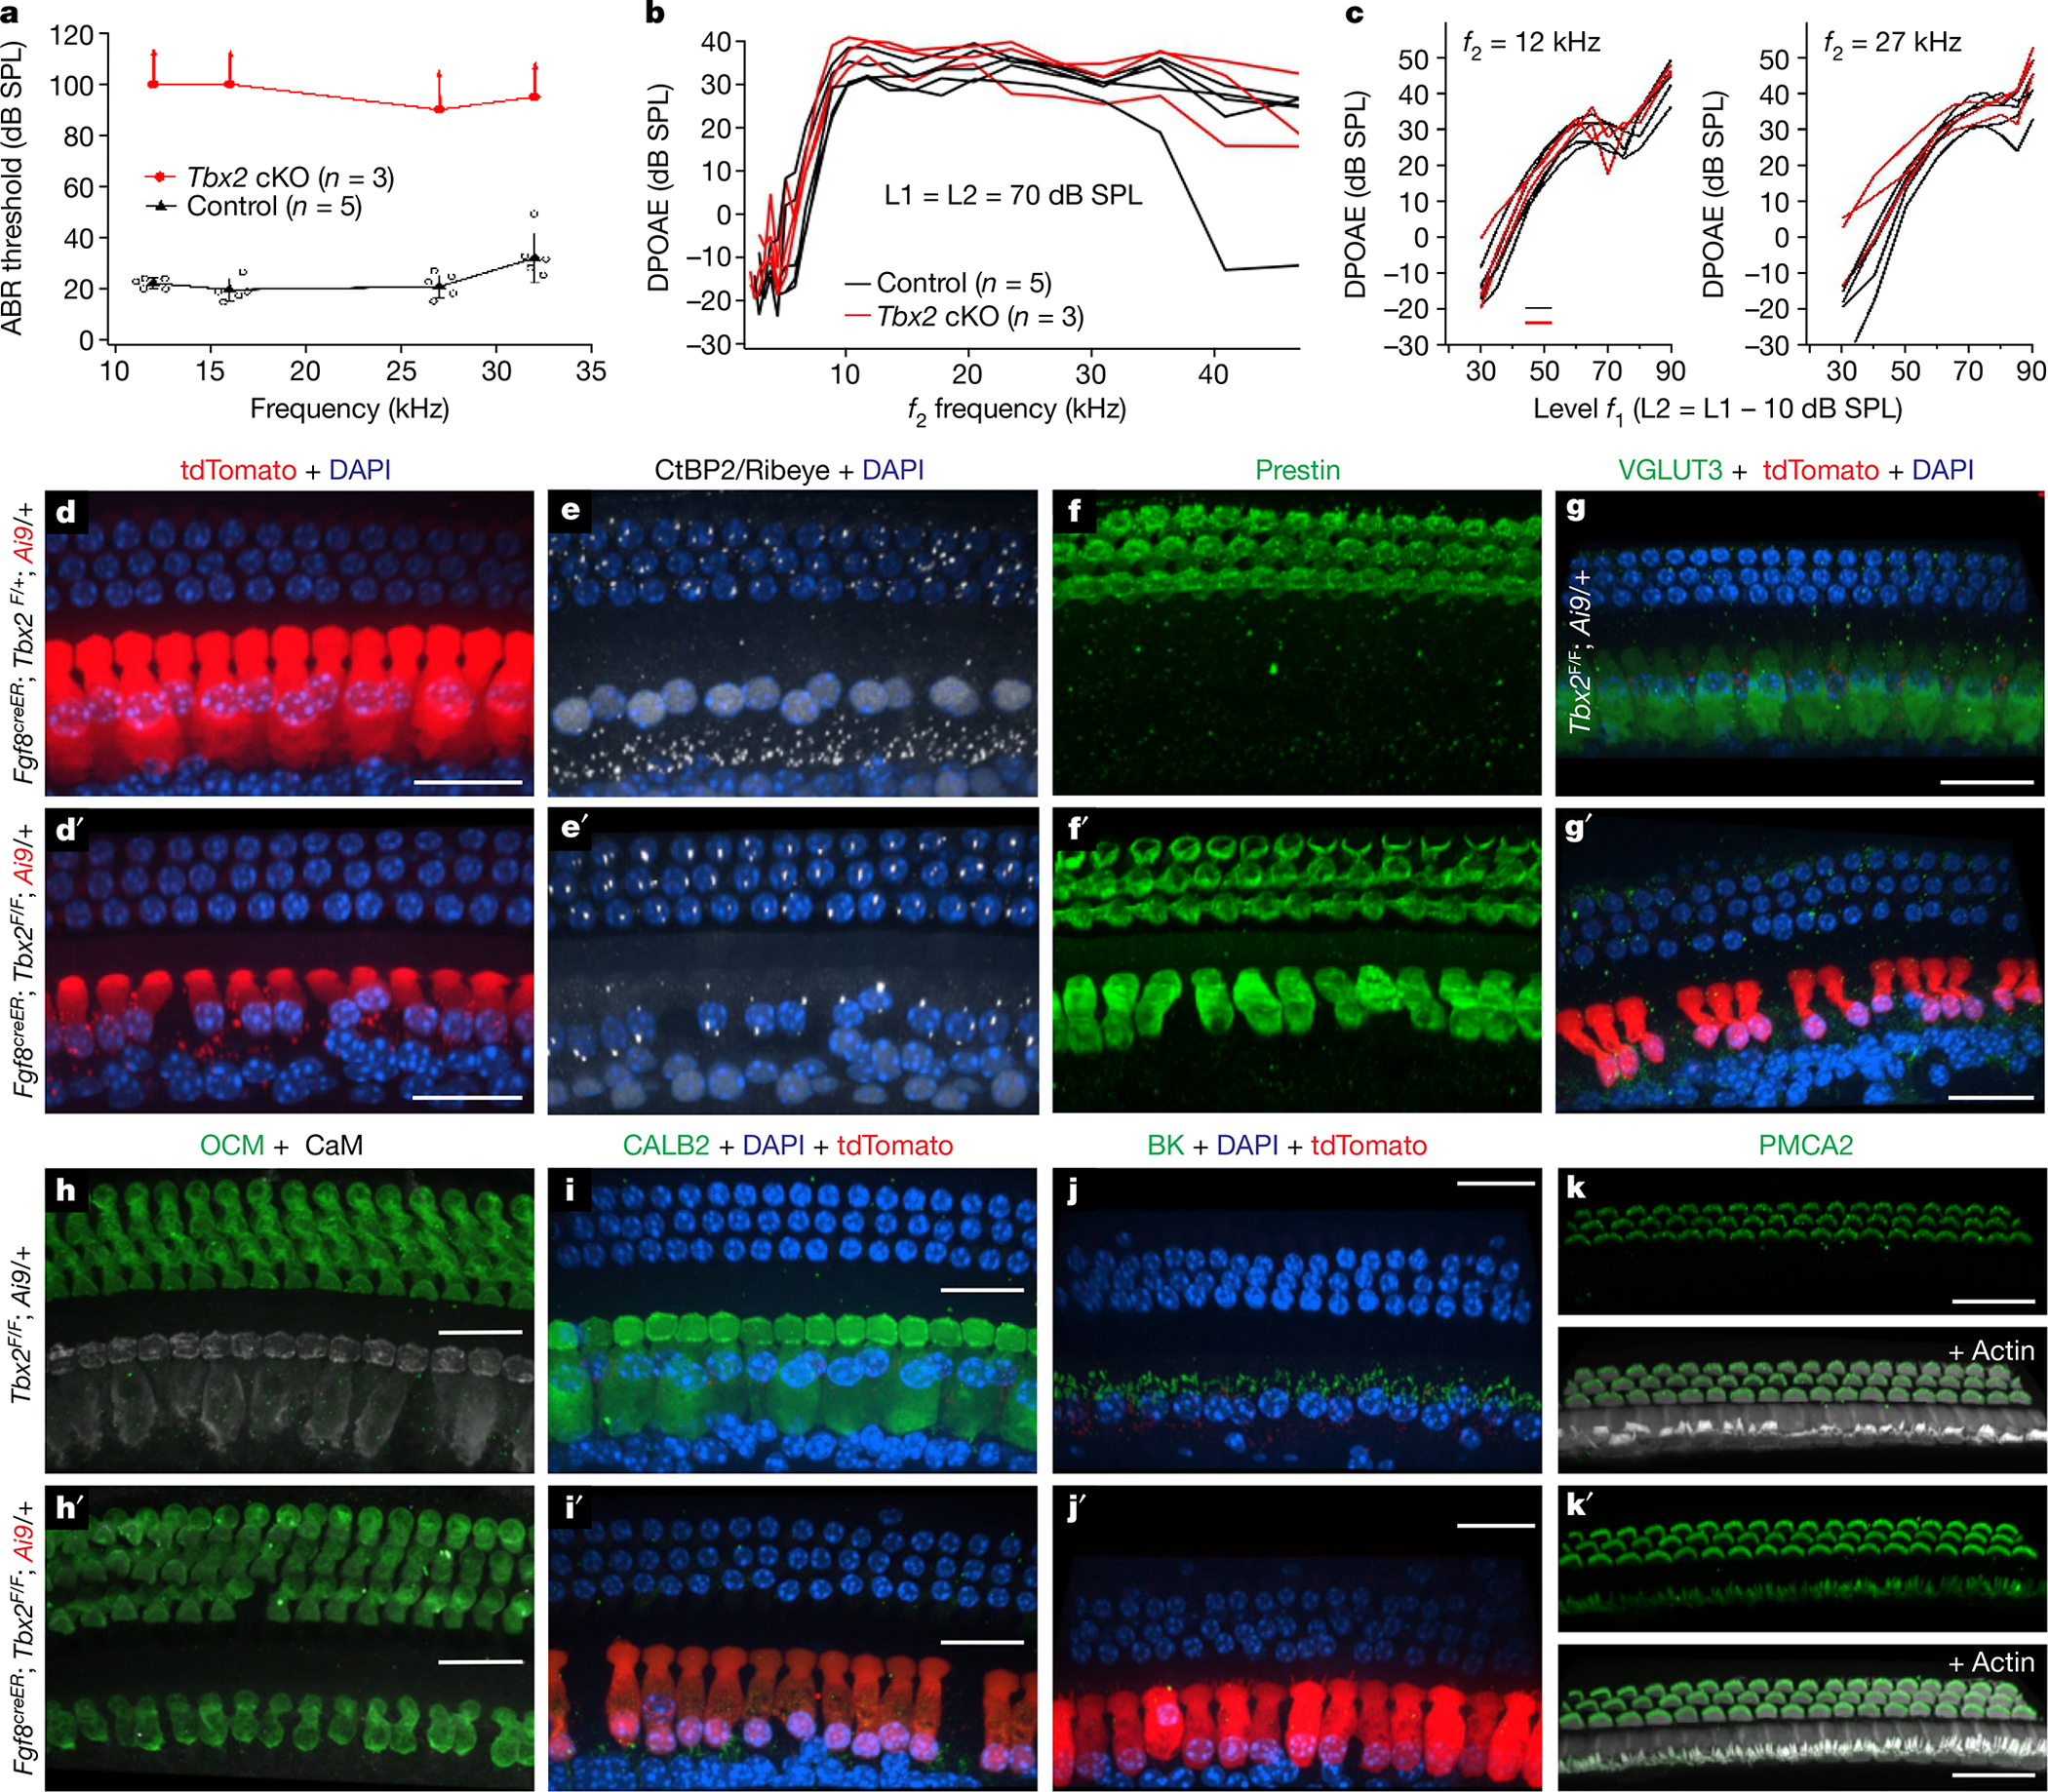
Fig. 3 |. Late or postnatal ablation of Tbx2 results in the transdifferentiation of IHCs into OHCs.

a–c, Hearing tests in post-weaning, mature mice (P31) in which Tbx2 was ablated in IHCs with tamoxifen at P7 or P9 (Fgf8creER/+; Tbx2F/F; R26LSL-tdTomato/+, with Fgf8creER/+; Tbx2F/+; R26LSL-tdTomato/+ and Tbx2F/F; R26LSL-tdTomato/+ littermates as controls). a, ABRs were absent in tamoxifen-treated mutants (up-facing arrows), whereas littermate controls had normal ABRs. Error bars, s.d.; centre symbols (triangles and ovals) indicate averages. b, c, Distortion product otoacoustic emissions (DPOAEs): iso-input functions (b) and input–output functions (c). The DPOAEs, which indicate OHC function, were similar to those of littermate controls, as expected for a phenotype affecting IHCs and not OHCs. d–k′, Immunohistochemistry on the mature cochleae of mice (P31 in d–i′; P27 in h, h′, k, k′; P28 in j, j′) in which Tbx2 was ablated in IHCs by tamoxifen administration at P7 (d′–g′) or P9–P11 (h′–k′). Control littermates are shown in d–k. d–f and d′–f′ depict the same cells labelled with various markers, whereas every other panel depicts a cochlear portion from a different animal. All examined cells in the position of IHCs displayed features of OHCs but not those of IHCs. These features include a cylindrical rather than flask shape; a small nucleus at the cell base rather than a large nucleus at the middle; few ribbons; and expression of prestin, oncomodulin and stereocilliary PMCA2 but not that of VGLUT3, CALB2, BK and nuclear CtBP2; the exception was stereocilia arrangement (lower panels in k, k′). The red fluorophore tdTomato results from Cre-dependent recombination of the Ai9 allele (R26LSL-tdTomato), thereby demonstrating recombination in the labelled cells (d, d′, g′, i′, j′). All images are confocal projections of apical (82–100% of the cochlear length; j, j′), mid-apical (approximately 57–82%; i, i′, k, k′) and mid-basal (approximately 31–57%; d–h′) portions of the cochlea. The images shown are examples of results obtained with at least three separate tissue samples (n = 3 biologically independent samples). Scale bars, 20 μm.
