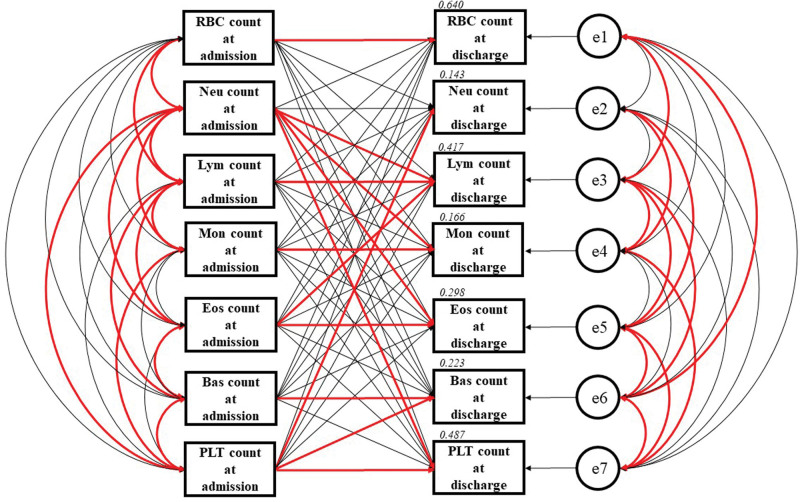
Figure 3.
Path model [B] based on structural equation modeling. An explanatory drawing of the possible cascade from RBC, Neu, Lym, Mon, Eos, Bas and PLT counts at admission to RBC, Neu, Lym, Mon, Eos, Bas and PLT counts at discharge. Each path has a coefficient showing the standardized coefficient of regressing an independent variable on a dependent variable in the relevant path. These variables indicate standardized regression coefficients (direct effect), correlations among exogenous variables [red bold typeface indicates significant values] and squared multiple correlations [narrow italics]. Bas = basophil, Eos = eosinophil, Lym = lymphocyte, Mon = monocyte, Neu = neutrophil, PLT = platelet, RBC = red blood cell.

