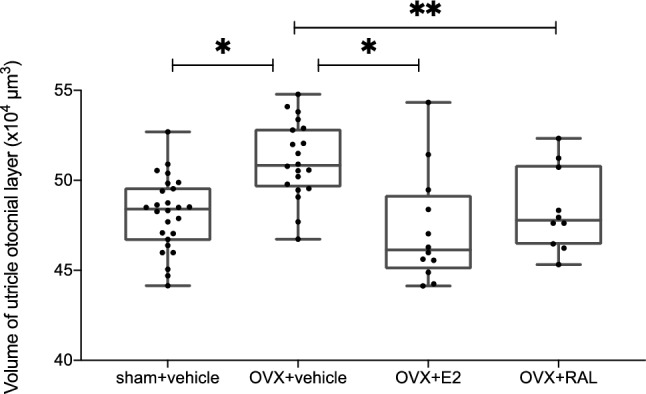
Figure 3.

The volume of the utricle otoconial layer was measured using a micro-CT scan (each n = 10–26). The volume of the utricle otoconial layer in the OVX + v group was significantly higher than that in the sham + v group (p < 0.001). The volumes of the utricle otoconial layers in the OVX + E2 and OVX + RAL groups were significantly lower than those in the OVX + v group (p = 0.007 and p = 0.04, respectively) (ANOVA: p < 0.001, *: p < 0.01, **: p < 0.05).
